What is Bricks?
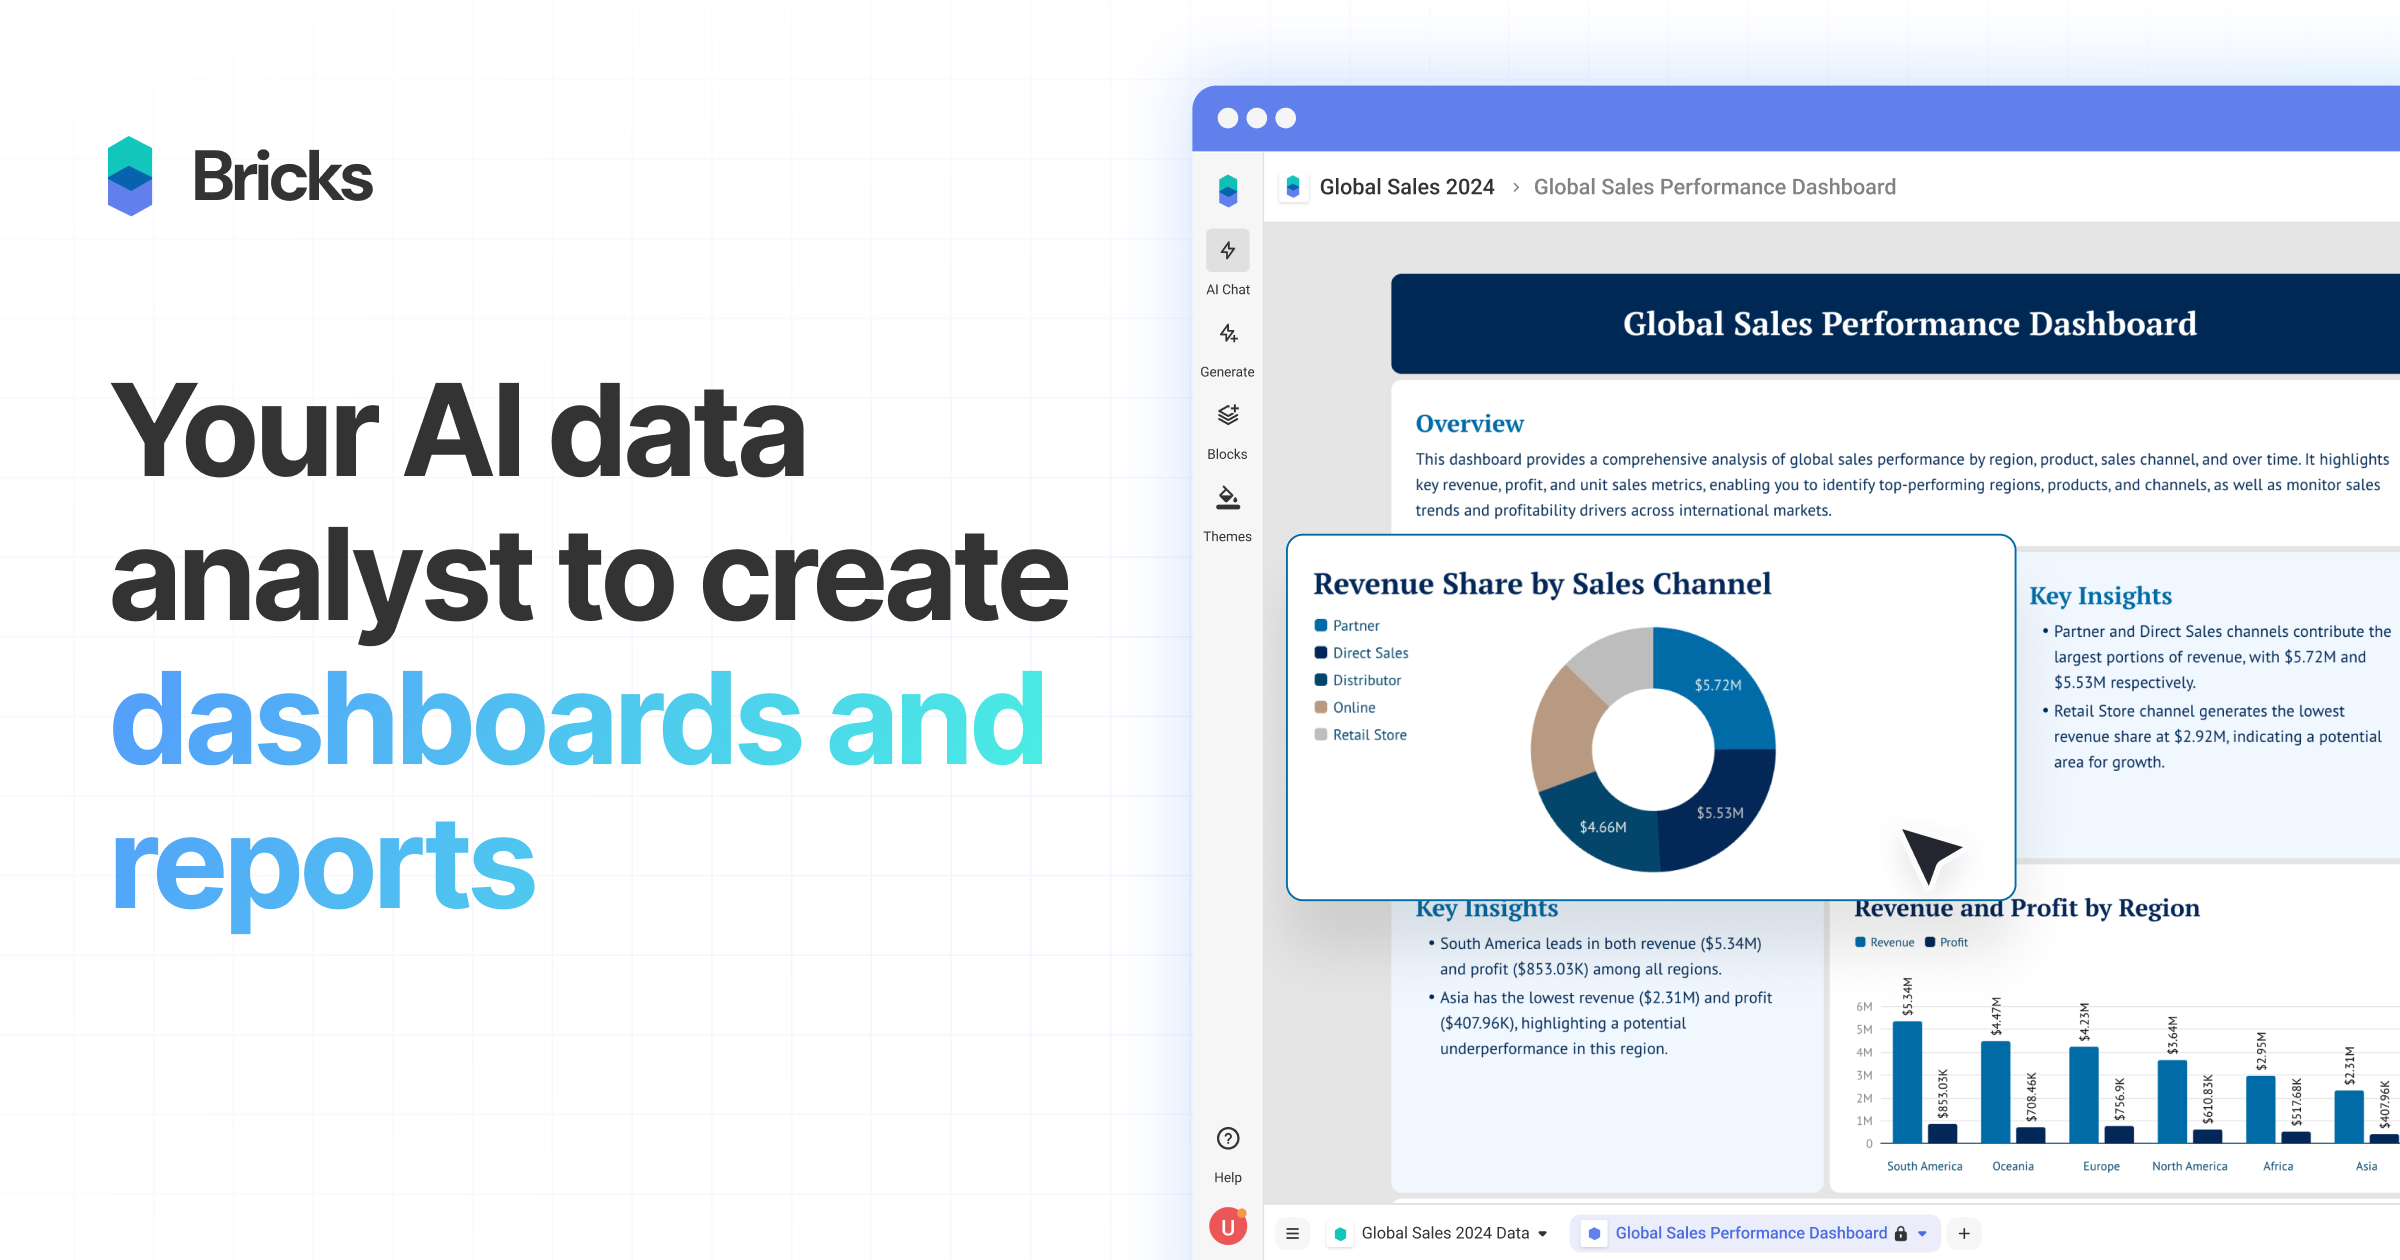
Bricks is an AI data analysis and reporting platform that transforms raw spreadsheet data into dynamic dashboards, charts, and written summaries in seconds.
Users upload CSV or Excel files, or connect data sources such as Google Sheets, databases, Airtable, Notion, HubSpot, and Google Analytics, then describe what they want in plain language while the AI interprets the data and builds professional visualizations.
It supports many chart types including geo maps, heatmaps, treemaps, sankey diagrams, funnels, and scatter plots, and offers interactive filtering, reusable templates, and data refresh that preserves layouts.
Bricks is aimed at small businesses, startups, and mid-market or enterprise teams in sales, marketing, finance, HR, operations, and support that want accessible analytics without complex business-intelligence software. Pros include a fast natural-language workflow, a wide range of visualization options, and many built-in connectors that reduce manual setup.
Cons are that highly customized or advanced statistical analysis may still require purpose-built BI tools, and the quality of output depends on clean source data.
Typical use cases include building a sales pipeline dashboard from a CRM export, summarizing marketing campaign performance for a weekly report, or turning a finance spreadsheet into a shareable executive view.
Because dashboards can be refreshed with new data while keeping their layout, teams can reuse a single template each reporting cycle instead of rebuilding charts from scratch. The pricing model is freemium, with a free tier to start and paid plans for larger workloads and teams.
Pricing changes often, so check the official site for current plans.
Key features of Bricks
- AI dashboard creation from CSV or Excel files
- Many visualization types including maps, heatmaps, and sankey diagrams
- Interactive filtering across dashboards
- 40+ data connectors and integrations
- Reusable dashboard templates and data refresh
Bricks pros and cons
| Pros | Cons |
|---|---|
| Fast natural-language path from data to dashboard | Advanced statistical analysis may need dedicated BI tools |
| Wide variety of professional chart types | Output quality depends on clean source data |
| Many built-in integrations reduce manual setup | — |
Bricks pricing
Bricks uses a freemium model: a free plan to get started, plus paid plans that unlock higher limits and advanced features. Pricing changes often, so check the official site for the latest plans and any free trial before you buy.
Who is Bricks for?
Bricks is best suited for ai data analyst turns spreadsheets into dashboards. Whether you are trying this kind of productivity & automation tool for the first time or use one every day, it is a credible option to shortlist — compare it with the alternatives and head-to-head comparisons linked on this page to find the best fit for your workflow and budget.
Bricks at a glance
| Detail | Summary |
|---|---|
| Category | Productivity & Automation |
| Pricing model | Freemium |
| Free option | Yes |
| Best for | AI data analyst turns spreadsheets into dashboards |
| User rating | Not yet rated |