
Conversational AI characters and NPCs for games Category: Emerging & Specialized.
Emerging & Specialized Review
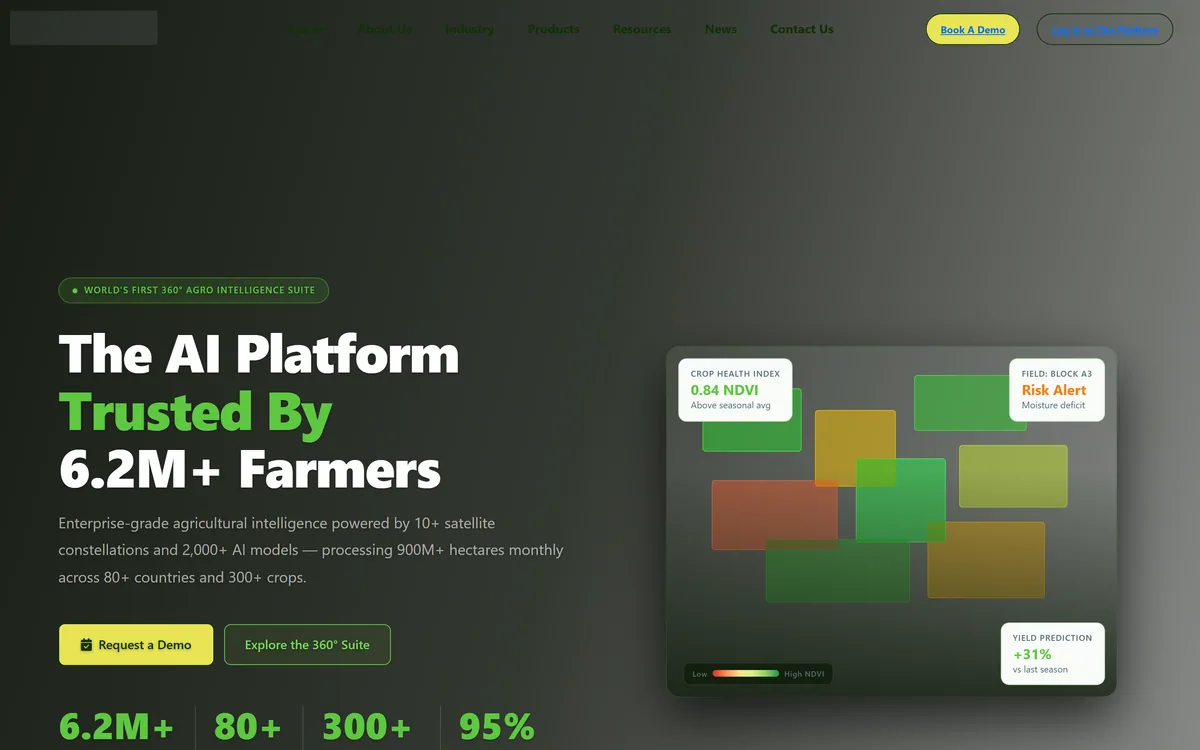
Map My Crop delivers agricultural intelligence from more than ten satellite constellations, covering automated field boundary detection, crop type identification, daily vegetation index monitoring, drone analysis, yield forecasting, irrigation modelling and risk scoring for lenders and insurers.
Very good
The underlying technology here is real and well established — multispectral satellite imagery genuinely reveals crop stress before it is visible from a tractor, and daily vegetation indices across a large holding are information no amount of walking produces. The tiered structure from field digitisation through to lending risk scores is a sensible way to sell to eight very different buyers. What needs discounting is the claim density: yield increases, cost reductions, accuracy figures and forecast precision are stated repeatedly and sourced nowhere, and two different accuracy numbers appear on one page. AInexfinder Editor Score: 4.0/5.
Best for: Large holdings that cannot be inspected field by field; Governments monitoring national crop area and food security
The visit link goes to mapmycrop.com, the official site. Paid placements on AInexfinder are always labelled. How we make money
The platform is built on 24/7 satellite health surveillance with NDVI and more than twenty vegetation indices updated daily, alongside crop type identification using multispectral analysis.
Understanding what a satellite genuinely measures explains both why this works and where it stops.
A multispectral sensor reads reflected light in bands the eye cannot see, and healthy vegetation has a distinctive signature — it absorbs red light for photosynthesis and reflects near-infrared strongly. Stressed plants reflect differently, and they do so before any visible change appears.
That gap is the whole value. A moisture deficit, a nitrogen shortage or an early disease front alters the spectral signature days or weeks before a farmer walking the field would notice, and at that point intervention still works.
What a satellite cannot do is tell you why. An index showing depressed vigour in one corner of a field is a signal that something is wrong there, not a diagnosis — and distinguishing water stress from disease from a compacted headland still requires someone to go and look.
A satellite sees stress days before a farmer walking the field would. It cannot tell you whether the cause is water, disease or compaction.
The first tier's headline capability is precise field maps without surveys, with automated delineation in minutes and an accuracy figure quoted across 80-plus countries.
This sounds administrative and is genuinely foundational, because almost everything downstream depends on knowing where a field is.
Field boundaries in much of the world are not digitised. They exist in paper records, in local knowledge, or in nothing at all — and without them there is no unit to attach a crop type, a yield estimate, an insurance policy or a loan to.
Manual delineation is the conventional alternative and it is slow and expensive at scale. Automated detection from imagery turns a survey project into a processing job, which is what makes national-scale monitoring feasible at all.
The consequences reach well beyond agronomy. Insurance claim verification, subsidy administration and lending against land all rest on an accurate boundary, and that is why the same platform ends up selling to banks and governments rather than only to farmers.
Beyond monitoring, the platform offers disease identification in under five seconds, yield forecasts up to three months ahead, irrigation modelling with zone-specific water stress maps, and risk scoring for lenders.
Those four have very different evidential standing, and it is worth separating them.
Index monitoring and alerting is the solid ground. Detecting that a zone has diverged from the field average is a measurement, and acting on it is straightforward — go and look, then irrigate, treat or leave it.
Yield forecasting is harder and more valuable. It depends on modelling how the rest of the season will go, and the further ahead the forecast, the more it rests on weather that has not happened. A three-month-ahead forecast is a projection with a confidence interval, and the interval is the part that matters.
Risk scoring for lenders is the most consequential and the least visible. A score deciding whether a smallholder gets credit is a decision about someone's livelihood made partly by a model, and the right questions are what it uses, how it was validated, and what recourse a farmer has when it is wrong — the same governance questions any data platform selling into lending should expect, as with Intelligence Node in retail pricing.
The platform states ten-plus satellite constellations and daily index updates across 900 million-plus hectares monthly in 80-plus countries.
Using many constellations rather than one is the correct architectural choice, and the reason is weather.
Optical satellites cannot see through cloud. A single constellation with a five-day revisit gives you an image every five days in theory and, during a wet growing season in a cloudy region, potentially nothing useful for a month — precisely when crop stress is developing fastest.
Combining constellations multiplies the chances of a clear view, because they pass at different times and orbits. It is the difference between a monitoring service and an occasional picture.
Radar-based sensing is the other answer to cloud, since radar penetrates it, and the site does not say whether any of its constellations are radar. That is the specific question to ask for any wet-season or tropical deployment, along with what the effective observation frequency is in your own region rather than the stated update cadence.
The homepage carries an unusual density of quantified claims: yield increases, input cost reductions, forecast accuracy, water savings, default prediction improvement, customer retention and payback period, alongside two different figures for AI accuracy in different sections.
None carries a source, a study, a sample or a definition, and that is the thing to hold in mind while reading the rest.
A stated average yield increase, for instance, cannot be evaluated without knowing against what baseline, on which crops, in which regions and over how many seasons. Agriculture varies so enormously by geography and season that an average across 80 countries is close to uninterpretable.
One displayed testimonial refers to a yield improvement figure so large that it is very unlikely to describe yield in the agronomic sense, which is the kind of thing a careful editor would query before publishing.
None of that impugns the technology, which is real. It means the numbers are marketing rather than evidence, and the credible signals on the page are elsewhere: ISO 27001, a named ISRO authorisation, NVIDIA's programme, and the specificity of the product tiers. Exported field data still has to be analysed somewhere, which is Quadratic's job, and the source-linking discipline Daloopa applies to filings would suit these numbers well.
Satellite agronomy fails when alerts arrive and nobody acts, which happens as soon as the alerts outnumber the people who can respond.
This sequence establishes trust in the data before scaling the coverage.
| Company | Hardcastle Agrotech Solutions Inc., per the footer |
|---|---|
| Positioning | Described as the world's first 360-degree agro intelligence suite |
| Data sources | Ten-plus satellite constellations, plus drone imagery |
| Processing scale | 900 million-plus hectares monthly, stated across 80-plus countries |
| Crops | 300-plus supported, with 150-plus identifiable by crop type detection |
| Indices | NDVI plus more than twenty vegetation indices, updated daily |
| Tier one | Field boundary detection, crop type detection, crop monitoring and tree monitoring |
| Tier two | Drone monitoring, disease detection, yield prediction and forest monitoring |
| Tier three | Irrigation modelling, sustainability and ESG reporting, and risk intelligence |
| Buyers addressed | Banks and insurers, government, cooperatives, farmers, plantations, food processing, input companies and agro holdings |
| Certifications displayed | ISO 27001, GDPR compliance, NVIDIA Inception and ISRO authorisation |
| Presence | Six global offices, with white-label and API options |
Automated field boundary delineation from imagery
Crop type detection across 150-plus crops
Daily NDVI and 20-plus vegetation indices
Individual tree health scoring for orchards
Drone imagery analysis at sub-metre precision
Yield forecasting up to three months ahead
Zone-specific irrigation modelling
Risk scoring and portfolio dashboards for lenders
Data platforms differ by what they observe and who they sell it to.
| Tool | Observes | Buyers | Best for |
|---|---|---|---|
| Map My Crop | Fields, from satellites and drones | Farmers, banks, governments, processors | Monitoring land at scale |
| Intelligence Node | Competitor pricing and assortment | Retailers and brands | Market rather than field data |
| Quadratic | Data you already have | Analysts | Analysing exports from a platform |
| Daloopa | Company financials | Equity analysts | Source-linked data in another domain |
| Parspec | Product specifications | Construction supply chain | Document-based rather than sensed data |
Other platforms turning observed data into decisions.
Last checked . Read from mapmycrop.com in a browser session on the date above, including the full footer. The screenshot was captured at the same time.
What we could not confirm: any of the quantified outcome claims, none of which carries a source, sample, baseline or definition — including yield increase, input cost reduction, forecast accuracy, water saving, default prediction improvement and payback period; why two different AI accuracy figures appear on one page; whether any constellation is radar-based, which determines usability in cloudy regions; what the ISRO authorisation covers; how risk scores are validated or appealed; and pricing, which requires a demo. We did not monitor a field.
AInexfinder does not list plan prices or billing details. For current pricing, plans, and trials, visit the official Map My Crop website.
Visit official website for pricingVendor pricing, credits, and billing policies change over time. Always confirm on the official site before you buy.
Map My Crop earns an AInexfinder Editor Score of 4.0/5 (very good). Best for: Large holdings that cannot be inspected field by field; Governments monitoring national crop area and food security; Insurers verifying claims with satellite evidence.
Visit Map My CropLog in to write a review.
No reviews yet. Be the first to share your experience with Map My Crop.
Assigned reviewer
Daniel ReedSenior AI Tools Reviewer
Daniel leads AInexfinder's tool reviews. He researches each tool from its own pricing, documentation and policies, checks its claims against independent sources, and writes up what it does well, where it falls short and who it genuinely suits.
Daniel and the AInexfinder editorial team research Map My Crop from its own website, pricing, documentation and policies, checked against independent sources. This review is research-based: unless its method note says otherwise, we have not bought a plan or run hands-on tests. The Editor Score is our editorial judgement, and payment never changes it.
Similar Tools
Conversational AI characters and NPCs for games Category: Emerging & Specialized.
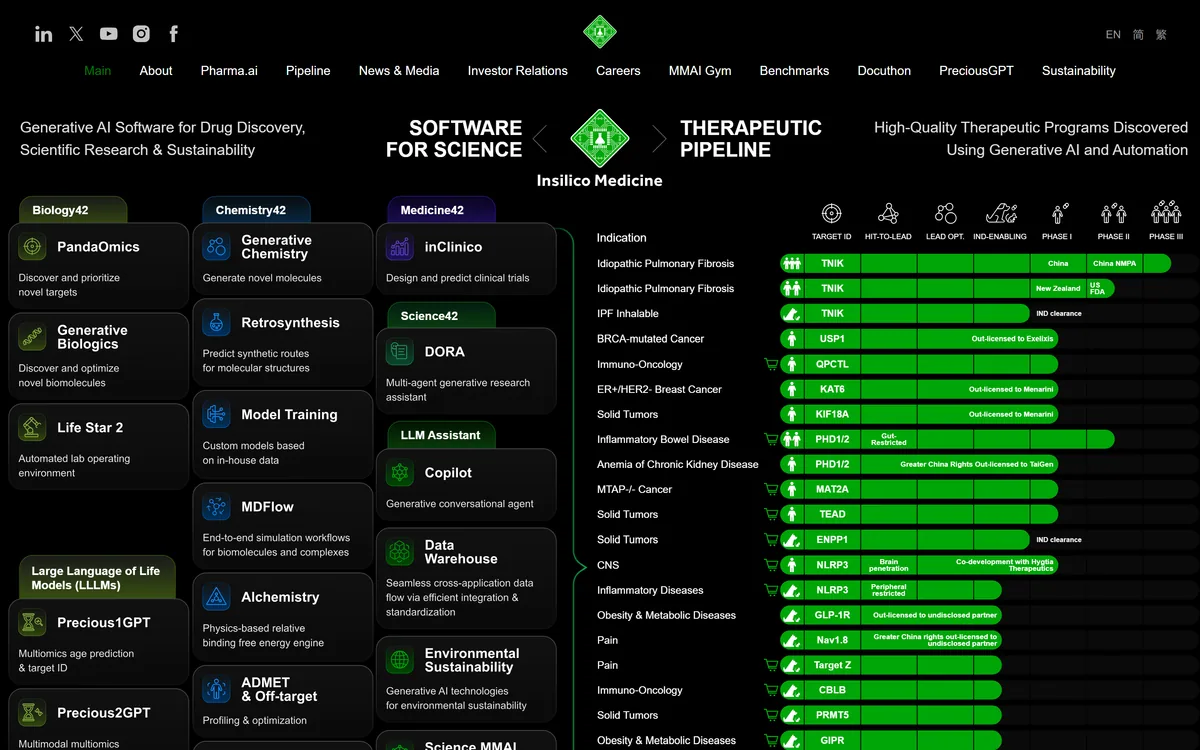
Insilico Medicine pairs the Pharma.ai software suite — PandaOmics, Chemistry42, inClinico and more — with its own clinical pipeline. Its lead candidate rentosertib, a TNIK inhibitor for idiopathic pulmonary fibrosis, has Phase IIa results published in Nature Medicine.
AI-powered stock scanning and trade idea generation platform Category: Emerging & Specialized.
AI digital accountant for bookkeeping and month-end close Category: Emerging & Specialized.
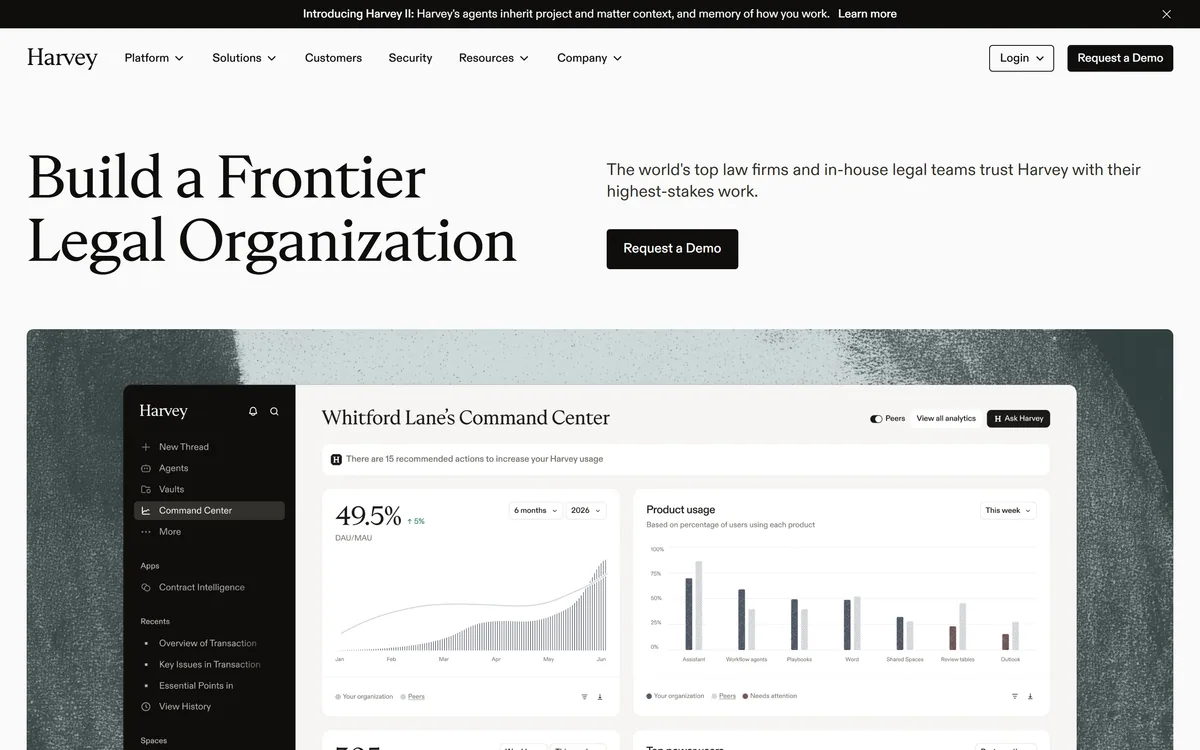

Harvey is an AI platform for legal and professional services — agents, a Vault for documents, Knowledge, Spaces, and Contract Intelligence — used by firms including A&O Shearman, Latham & Watkins, and Norton Rose Fulbright.
Automated crypto trading bots with AI strategy tools Category: Emerging & Specialized.
Related Pages