Teams building on language models discover observability in the same way, and it is always after an incident. A customer reports that the assistant said something wrong, and nobody can find what it actually said — because the prompt was assembled from four sources at runtime, the response was streamed, and nothing was kept.
That is a worse position than it sounds. With conventional software you have a stack trace. With an LLM feature you have a bill, a complaint, and no way to reproduce what happened.
Helicone exists for that gap, and it approaches it as a gateway rather than a passive monitor — a decision that buys real capability and costs something specific. Both are worth understanding before you put it in a request path.
What Does Helicone Watch?
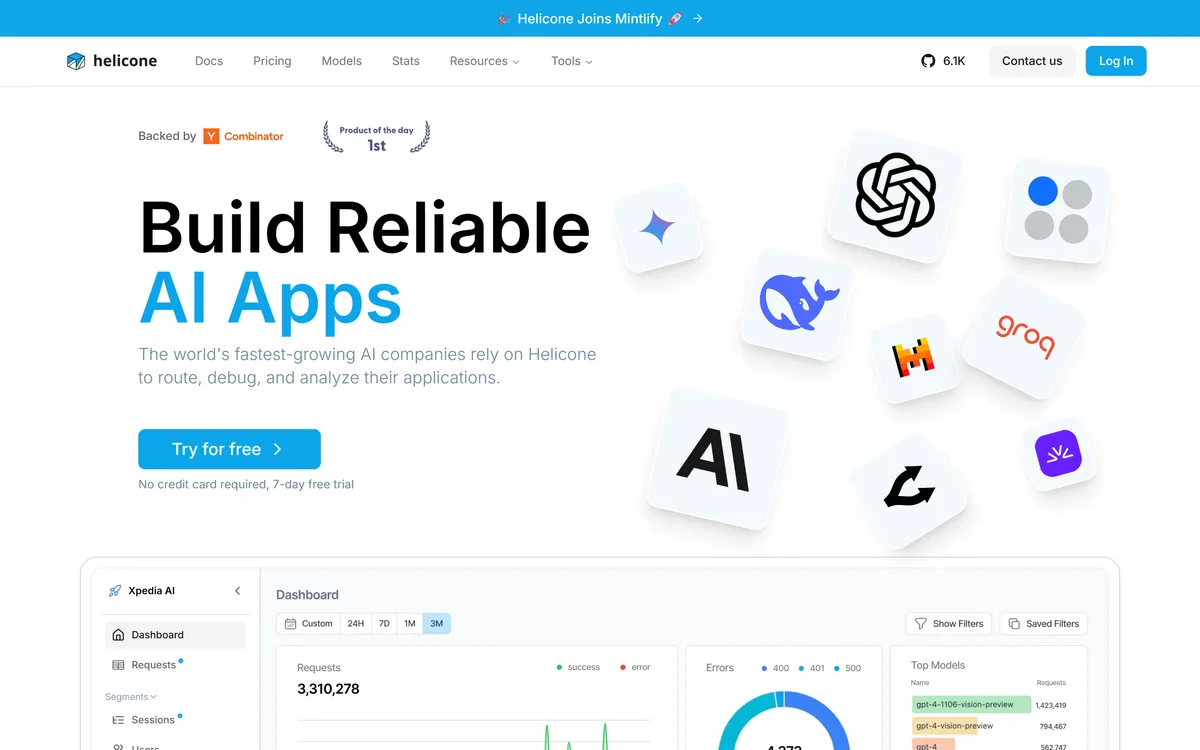
- Every LLM call your application makes — logged, searchable and attributable, across OpenAI, Anthropic, Gemini, Mistral, Groq, Together AI and OpenRouter.
- Sessions and users, not just requests, which is what lets you reconstruct what a specific person experienced rather than reading isolated calls.
- It is a gateway as well as a monitor — it routes requests, which is what makes rate limits and caching possible.
- HQL, its query language, plus prompt management, datasets, a playground and alerts.
- Open source and self-hostable, which resolves the objection that your prompts and responses would otherwise flow through someone else's infrastructure.
LLM Observability Vocabulary
Five terms that decide whether you can debug an AI feature in production.
- Gateway versus proxy logging
- A gateway sits in the request path and can cache, route and refuse. Async logging receives a copy afterwards and cannot affect anything. Different capabilities, different production risk.
- Session
- A group of related LLM calls belonging to one user interaction. The unit you actually debug, because a single request rarely contains the problem.
- Prompt versioning
- Tracking which prompt was live when. Without it, you cannot tell whether output changed because you edited a prompt or because the model changed underneath you.
- Cost attribution
- Assigning spend to individual users or features. LLM costs are far more skewed per user than most teams expect, and totals hide that entirely.
- Dataset
- A collection of real production requests, ideally including failures, used to evaluate prompt changes. Better test material than anything you would write yourself.
Why Is A Gateway Different From Logging?
Helicone describes itself as helping companies route, debug and analyse their applications, with AI Gateway functionality alongside observability.
The distinction matters architecturally. A passive logger receives a copy of what happened, asynchronously, and cannot affect it. A gateway sits in the path — your application calls Helicone, Helicone calls the provider, the response comes back through it.
That position is what makes several features possible at all. Caching requires intercepting a request to decide whether to answer it. Rate limiting requires the ability to refuse one. Routing between providers requires being the thing that chooses. None of those work from a sidecar.
The cost is equally structural. Anything in the request path adds latency and becomes a dependency: if the gateway is unavailable, your feature is unavailable, unless you have built a bypass. That is a materially different risk profile from a logging integration that can fail silently without anyone noticing.
It is a fair trade and it is a decision to make deliberately. If you want caching, rate limits and routing, you want a gateway. If you only want visibility, an asynchronous logging path avoids taking on a new production dependency — and it is worth asking which mode you are configuring.
The distinction matters most when something breaks. Error monitoring such as Sentry Seer tells you the request failed; a gateway tells you what was sent, what came back, and what it cost.
A logger can fail silently. A gateway that fails takes your feature with it — which is the price of being able to cache, route and refuse.
Sessions Are The Feature That Solves Real Debugging
Helicone's dashboard covers requests, segments, sessions and users. Sessions are the one that changes what you can actually diagnose.
An individual LLM request is rarely the problem. A user asks something, the app retrieves context, calls a model, calls it again with a tool result, and produces an answer that is subtly wrong — and no single request in that chain looks wrong on its own.
Grouping calls into a session lets you replay the sequence: what was retrieved, what was sent, what came back, in order. That is the difference between guessing and reproducing.
User-level attribution matters for a second reason that is commercial rather than technical. LLM features have per-user costs that vary enormously — one power user can consume more than a thousand casual ones — and without attribution you cannot tell whether a customer is profitable, or which behaviour is driving your bill.
Prompt Management Is More Useful Than It Sounds
Alongside logging, Helicone offers prompt management, datasets and a playground. Together these address a problem most teams solve badly.
Prompts start in code as string literals. They get edited, and nobody records which version was live when. Then output quality changes, and the question — did we change the prompt or did the model change underneath us — becomes unanswerable.
Versioned prompt management makes that answerable, and it decouples prompt edits from deployments. Someone who understands the domain but does not deploy code can improve a prompt, which is frequently the person best placed to do it.
Datasets are what turn logs into evaluation material. Real production requests, particularly the ones that went wrong, are far better test cases than anything you would invent — and having them collected means a prompt change can be checked against reality rather than intuition.
The playground closes the loop: take a real failing request from production, adjust the prompt, and see what would have happened. That workflow — production failure to reproduction to fix, all in one place — is the practical argument for this category of tool.
Versioned prompts also make regressions attributable, which is the argument incident tools like Resolve.ai and Traversal make about deploys: you cannot debug what you cannot pin to a change.
- Version your prompts before you need to, because you cannot reconstruct history retroactively.
- Build a dataset from real failures rather than invented examples; production is a better test author.
- Attribute cost per user early, since LLM economics vary far more between users than most teams expect.
- Decide deliberately between gateway mode and async logging — they carry different production risks.
- Set rate limits per user before a runaway loop discovers your provider's spend limit for you.
What Open Source Actually Resolves Here
Helicone is open source with a public repository, and this matters more in observability than in most categories.
The reason is what flows through the tool. Prompts and responses contain whatever your users typed and whatever your system knew — customer data, internal context, sometimes regulated information. Routing all of that through a third-party service is a genuine governance question, and for some organisations a blocking one.
Self-hosting removes it. The same capability runs on your infrastructure, and no prompt leaves your network. For a team in healthcare, finance or a jurisdiction with strict residency rules, that is the difference between adopting observability and doing without it.
It also protects against the ordinary risk of depending on a young company. An open-source project you can run yourself does not disappear because a vendor was acquired or changed its pricing.
The gaps worth noting are that the specific licence and the self-hosting requirements are not described on the pages we read, and open source does not mean effortless — running the ingestion, storage and query layers for high request volume is real operational work. Check the repository for both before assuming self-hosting is the cheaper path.
Deployment terms are the same worry that speech providers like AssemblyAI field before anyone asks about accuracy, and open source answers it more completely than a contract clause can.
Instrumenting An Application Properly
Observability is easy to add badly — logging everything, attributing nothing, and ending up with a searchable pile you never query.
The bar is step four. If you cannot reconstruct a specific user's session from logs, you have storage rather than observability.
- Decide gateway or async logging first, based on whether you want caching and rate limiting or only visibility. This is a production architecture decision, not a settings toggle.
- Instrument with user and session identifiers from the very beginning. Adding attribution later cannot recover the history you did not tag.
- Log a week of real traffic, then look at cost per user rather than cost in total. The distribution will be more skewed than you expect.
- Take a real complaint and try to reconstruct exactly what happened from the session view. If you cannot, your instrumentation is incomplete.
- Build a dataset from the twenty worst responses of that week and use it as your regression test for any prompt change.
- Set per-user rate limits before you need them, since the alternative is discovering your provider's spend cap during an incident.
Trial, Tiers And The Self-Host Alternative
There is a 7-day free trial with no credit card required, and paid tiers above it; amounts are not disclosed on the pages we read. Self-hosting is available through the open-source repository.
Observability tools in this category normally price on volume — requests or logs retained — which is the sensible shape, since cost tracks how much you actually put through.
The variable to watch is retention rather than throughput. Logging a million requests is cheap; keeping them queryable for a year is not, and retention windows are where the real cost difference between tiers usually sits. Establish what your tier keeps and for how long.
The self-hosting option changes the calculation entirely for anyone at volume, trading a subscription for infrastructure and operational time. Whether that is cheaper depends on how much of the latter you have.
The company is backed by Y Combinator and the repository shows meaningful adoption. We do not publish amounts; check retention windows and whether gateway and logging modes are priced differently.
Helicone: Providers, Features And Scale
| Product type | Open-source LLM observability and AI gateway |
|---|
| Core function | Route, debug and analyse LLM applications |
|---|
| Dashboard views | Requests, Segments, Sessions, Users |
|---|
| Query language | HQL |
|---|
| Additional features | Prompt management, datasets, playground, rate limits, alerts |
|---|
| Supported providers | OpenAI, Anthropic, Gemini, DeepSeek, Mistral, Groq, Together AI, OpenRouter and others |
|---|
| Documented integrations | OpenAI, Anthropic, Azure, LiteLLM, Anyscale, Together AI, OpenRouter and more |
|---|
| Open source | Public repository, with 6.1K GitHub stars noted |
|---|
| Trial | 7-day free trial, no credit card required |
|---|
| Backing | Y Combinator |
|---|
| Legal entity | Helicone, Inc. |
|---|
| Pricing model | Trial plus paid tiers; amounts not disclosed |
|---|