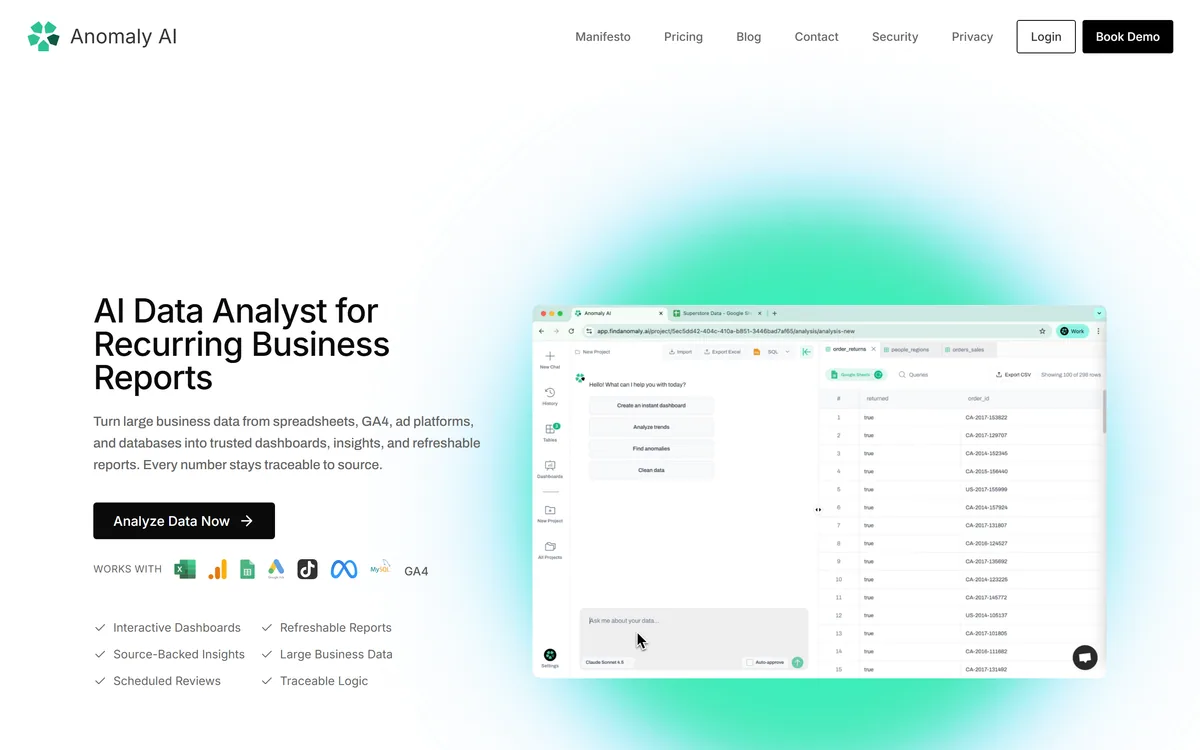
Anomaly AI turns spreadsheets, ad platforms and databases into refreshable dashboards and stakeholder-ready reports with traceable logic. It connects to GA4, Google Sheets, Google Ads, Meta Ads, TikTok Ads, BigQuery and MySQL alongside Excel and CSV files.
findanomaly.ai8 viewsAdded June 26, 202615K visitors
There is a specific kind of work that consumes an unreasonable share of analysts' time and appears on nobody's job description: rebuilding the same report. The monthly marketing review, the quarterly retention deck, the weekly revenue summary. The structure never changes. The data always does. Someone spends two days a month re-doing it anyway.
Anomaly AI is aimed squarely at that. It ingests spreadsheets, ad platforms and databases, cleans and transforms them, and produces dashboards and reports that refresh rather than being rebuilt — with the calculation behind each number inspectable.
This review covers why traceability is the feature that matters, what the connector list tells you about who it is for, where the four-step workflow does and does not remove work, and the limits of trusting an AI with a number a board will read.
The differentiator is not the chart — it is being able to see how the number was calculated.
Anomaly AI's Actual Proposition
Recurring, not ad hoc. It is aimed at the monthly report you rebuild every month, which is where the real time goes.
Traceable logic is the trust mechanism — you can see how a number was derived, which is what separates this from a chatbot that produces a figure.
Reports refresh rather than being rebuilt, so last month's structure survives contact with this month's data.
Connectors cover the usual stack: Excel and CSV, GA4, Google Sheets, Google Ads, Meta Ads, TikTok Ads, BigQuery and MySQL.
It sits between spreadsheets and a BI platform, which is a real and underserved gap — not everyone outgrowing Excel is ready for Looker.
Traceable Logic Is The Whole Trust Argument
Anyone can produce a plausible number. The problem in business reporting is that a plausible wrong number is worse than no number, because someone acts on it.
This is the specific reason general-purpose AI analysis has struggled to get into recurring reporting. Ask a chatbot for last quarter's churn and it will give you a figure with total confidence. Ask how it got there and you may or may not get something you can verify. No finance team is putting that in a board pack.
Anomaly AI's Traceable Logic and Source-Backed Insights features address exactly this. A number that can be traced back through its transformations to the source rows is auditable, and auditability is what makes a number usable in a decision rather than merely interesting.
It is also what makes the report survivable when someone challenges it. 'The dashboard says so' loses that argument. 'Here is the filter, the join and the rows' wins it.
In recurring reporting, the question is never whether the chart looks good. It is whether you can defend the number when the CFO asks where it came from.
Reading The Connector List
The integrations are Excel and CSV files, Google Analytics 4, Google Sheets, Google Ads, TikTok Ads, Meta Ads, Google BigQuery and MySQL. That list is a portrait of the intended customer.
Three paid-media platforms plus GA4 says marketing reporting is the primary use case, and it is the obvious one — performance reporting is monthly, repetitive, and spread across platforms that each insist on their own definitions.
Spreadsheets and Google Sheets say the customer is coming from Excel rather than from a warehouse. BigQuery and MySQL say some of them have grown past that, or have one engineer who has.
What the list does not include is as informative. There is no Salesforce, no HubSpot, no Stripe, no NetSuite. If your recurring report needs CRM or billing data, check that gap before evaluating anything else — a reporting tool that cannot reach half your data is a partial answer no matter how good the other half looks.
The Four Steps, Honestly Assessed
The workflow is Upload, Clean, Transform, Visualise. Each step removes a different amount of real work, and it is worth being specific about which.
Upload And Clean
Automatic data validation and type detection is the least glamorous capability here and possibly the most valuable. Anyone who has spent an afternoon discovering that a date column arrived as text, or that a currency field contains three formats, knows this is where recurring reporting actually breaks.
It removes tedium reliably. It does not remove judgement — deciding whether an outlier is a data error or a real event is a business question, and an automated cleaner that silently drops it has made that decision for you.
Transform
Applying calculations and KPIs is where definitions live, and definitions are where reporting disputes actually happen. 'Active user' means four different things in most companies, and the argument is never about the arithmetic.
The value of having transformations defined once and reused monthly is consistency — the same definition every period, which is the thing manual rebuilding quietly breaks. Someone still has to make the definition correct in the first place.
Visualise And Schedule
Dashboards, refreshable reports and Scheduled Reviews close the loop. Scheduling is what converts the tool from something you use into something that runs.
Worth noting the standard risk: a report that arrives automatically is a report people stop reading. Scheduling saves the production time and does nothing about the attention problem, which stays a management question rather than a software one.
Where It Sits Between Excel And BI
The gap Anomaly AI targets is real. Below it are spreadsheets, which are flexible, universally understood and quietly disastrous at scale — every recurring spreadsheet report eventually accumulates a broken reference nobody notices for two quarters. Above it are full BI platforms, which are powerful and expensive in the currency that actually constrains teams: someone who knows how to model data.
A great many organisations are stuck between. They have outgrown spreadsheets and cannot justify a data team, and they keep rebuilding reports manually because the alternative requires expertise they do not have.
For that middle, a tool that ingests the platforms they already use, applies definitions consistently and shows its working is a genuinely good answer.
The caveat is what happens on either side of the gap. Below it, a small team with two straightforward reports probably does not need this. Above it, an organisation with a warehouse and analysts will want the control of a full BI stack, and will find any tool that automates the modelling decisions constraining rather than helpful.
Setting Up A Report You Can Defend
The first report determines whether every subsequent month is trustworthy, so it deserves disproportionate care.
Pick the report you rebuild most often, not the most impressive one — recurrence is where the saving is.
Check your connectors cover every source that report needs before building anything.
Write down your metric definitions before configuring transformations, and get whoever argues about them to agree first.
Rebuild one past period and reconcile it against the version you produced manually. Any discrepancy is a definition problem, and finding it now is far cheaper than finding it in a board meeting.
Trace two or three headline numbers back to source rows yourself, so you know the audit trail works before you need it.
Only schedule the report once a period has reconciled cleanly.
Review the definitions quarterly. Metrics drift as businesses change, and an automated report will keep producing last year's definition indefinitely.
Different answers depending on whether your problem is finance, research or reproducibility.
Numeric — purpose-built for the accounting close rather than general reporting
Daloopa — extracts financial data with links back to the original filing
Puzzle — financial operations where ledger-level traceability is the requirement
marimo — reproducible analysis notebooks when you would rather write the code
Brandwatch — audience and market signal that a performance report cannot supply
Read From The Product Site
Last checked . Taken from findanomaly.ai during this check, with the screenshot above captured at the same time.
Positioning around interactive dashboards, refreshable business reports and stakeholder-ready summaries with traceable logic, quoted from the site
Feature names — Interactive Dashboards, Refreshable Reports, Source-Backed Insights, Scheduled Reviews, Traceable Logic — listed on the site
Integrations covering Excel and CSV, Google Analytics 4, Google Sheets, Google Ads, TikTok Ads, Meta Ads, Google BigQuery and MySQL
Automatic data validation and type detection described as part of the cleaning step
The four-step workflow of upload, clean, transform and visualise, as presented on the site
Named audiences across marketing, finance, product, HR and operations, and client service teams
Blog, tutorials, glossary, connector documentation, contact, security and privacy pages present in the site footer
No plan prices published here, in line with this site's pricing policy
The connectors listed above are those published at the time of this check; verify current coverage against your own sources before committing. Observations about metric definitions and automated report fatigue are general points about business reporting rather than criticisms of this product.
Editor's Verdict
4.0/5
Anomaly AI has an AInexfinder Editor Score of 4.0/5.
Video demo
Anomaly AI pricing
AInexfinder does not list plan prices or billing details. For current pricing, plans, and trials, visit the official Anomaly AI website.
Vendor pricing, credits, and billing policies change over time. Always confirm on the official site before you buy.
Frequently asked questions
What does 'traceable logic' actually mean?
That you can follow a number back through its transformations to the source rows. It matters because a plausible wrong number is worse than no number — and because 'the dashboard says so' loses an argument that 'here is the filter, the join and the rows' wins.
Which data sources does it connect to?
Excel and CSV files, Google Analytics 4, Google Sheets, Google Ads, Meta Ads, TikTok Ads, Google BigQuery and MySQL. Notably absent are CRM and billing systems — if your recurring report needs those, check that gap before evaluating anything else.
Is this a replacement for a BI platform?
No, and it is not trying to be. It targets the gap between spreadsheets and BI — organisations that have outgrown Excel but cannot justify a data team. If you already have a warehouse and analysts, a full BI stack will give you control this cannot.
Can I trust the numbers in a board pack?
Only after you have reconciled a past period against a report you produced manually and traced a few headline figures back to source yourself. The traceability makes that check possible; doing the check is still your job, and it is the step that earns the trust.
What happens to outliers during cleaning?
Automatic validation and type detection handles genuine data errors well. Whether an outlier is an error or a real event is a business question, and any automated cleaner that silently drops it has answered that for you. Worth checking how it behaves on data you already understand.
Does it help if our metrics are not agreed?
It makes the disagreement permanent rather than resolving it. Transformations apply whatever definition you configure, consistently, every period. Write the definitions down and get the people who argue about them to agree before you build anything.
What is the biggest saving in practice?
Not the analysis — the rebuilding. The monthly report whose structure never changes and whose data always does is where the two days a month actually go. Refreshable reports plus scheduled reviews are aimed precisely at that, and it is the reason to buy.
Daniel reviews AI tools the slow way — by actually using them on real projects. His reviews cover what works, what breaks, and who each tool is genuinely a good fit for.
Daniel and the AInexfinder editorial team research Anomaly AI using public product information, listing evidence, and (when available) hands-on checks. Scores reflect listing completeness and transparency — not paid placement.
Listings may include affiliate or sponsored placements, which are labeled when present. Editorial scores and cons are not sold. See our affiliate disclosure and review methodology.
Listomize is an Etsy SEO platform that generates titles, tags, and descriptions within Etsy's own limits, scores listings, optimises 100+ listings from a CSV, tracks competitors and trends, and auto-generates Pinterest pins.
Lahjty (لهجتي) is an Arabic-first marketing platform for MENA campaigns. From one brief it produces dialect-aware ad copy, headlines, campaign images with Arabic text rendered in, dialect-aware voice, and SEO articles grounded in your own brand sources — with a Partner API and an MCP server for teams that want it inside their own workflow.
MaxAEO is an answer engine optimisation platform from HIII PTE. LTD. It tracks how ChatGPT, Gemini, Claude, Perplexity, Copilot, Grok and Google's AI surfaces mention a brand, with sentiment, competitor benchmarking and citation tracing.
Mailjet is a Sinch-owned email platform handling both marketing campaigns and transactional sending from one account. It offers a collaborative drag-and-drop editor, an email API with SMTP relay, AI generation and segmentation, and EU-based data centres.
Outranking is an AI SEO content platform that writes briefs and first drafts and optimises them with real-time scoring, grounding content in live SERP data through its Concepts feature, with keyword clustering, internal linking and content workflows.
Helium 10 is an all-in-one platform for Amazon, Walmart and TikTok Shop sellers, covering product research, keywords, listing optimisation, advertising, operations and analytics — now fronted by an AI agent and an MCP connector.