Tamarind Bio is a cloud platform that puts the state of the art in computational biology, AlphaFold, RFdiffusion, ProteinMPNN, GROMACS and over a hundred more tools, behind one web interface and API, so scientists can design antibodies, peptides, enzymes and small molecules without deploying anything.
EOSDA Crop Monitoring
Verified
EOSDA Crop Monitoring is a satellite-based precision agriculture platform from EOS Data Analytics. It combines Sentinel-2 and PlanetScope imagery with ten vegetation indices, growth-stage tracking, risk maps, yield estimation and variable-rate application maps.
4.3Editor Score
eos.com12 viewsAdded November 9, 2025285K visitors
Satellite crop monitoring has an obvious appeal and a less obvious limit. The appeal is that you can see every field you farm without driving to any of them. The limit is that a satellite measures reflected light, and reflected light tells you something is wrong without telling you what.
EOSDA Crop Monitoring, from EOS Data Analytics, is one of the more complete attempts to close that gap. It layers vegetation indices, growth-stage tracking, weather, risk maps and yield estimation over Sentinel-2 and PlanetScope imagery, and pushes the output into things you can act on — including variable-rate application maps and a John Deere integration.
This review is about where that chain holds and where it breaks: which indices answer which question, why cloud correction is not a footnote, and what the platform genuinely cannot see.
Platform Specification
| Company | EOS Data Analytics, Inc. |
|---|---|
| Product type | Satellite-based precision agriculture and crop monitoring |
| Imagery sources | Sentinel-2 and PlanetScope |
| Best resolution | Up to 3 metres, with daily monitoring on the commercial source |
| Vegetation indices | 10, including NDVI, NDMI, RECI and MSAVI |
| Image correction | Cloud and shadow removal |
| Named features | Growth Stages, Risk Map, VRA Maps, Field Activity Log, Yield Estimation, Weather Analytics, Automated Reports, Team Management |
| Machinery integration | John Deere |
| Intended users | Growers, agricultural consultants, insurers, regional monitoring bodies |
| Related products | LandViewer, EOS RayVision, EOSDA API Connect |
| Delivery | Cloud platform |
What This Platform Buys A Grower
- Scouting triage, not scouting replacement. The imagery tells you which field is behaving oddly; your boots still tell you why.
- Two imagery sources: free Sentinel-2 on its regular cycle, and commercial PlanetScope at up to three-metre resolution with daily revisit.
- Ten vegetation indices including NDVI, NDMI, RECI and MSAVI — different indices answer different questions, and using one for everything is the common mistake.
- Beyond imagery: growth stages, risk maps, weather analytics, yield estimation, a field activity log and variable-rate application maps.
- Cloud and shadow removal matters more than it sounds — an uncorrected cloudy pass reads as a crop problem that is not there.
Two Satellites, Two Different Bargains
The imagery underneath determines what the rest of the platform can do, and the two sources are not interchangeable.
Sentinel-2 is the European Space Agency's open programme. It is free, well-calibrated, and revisits on a fixed multi-day cycle at around ten-metre resolution for the key bands. For season-long trend watching across many fields it is entirely sufficient.
PlanetScope is commercial, reaches up to three-metre resolution, and revisits daily. That combination matters in exactly two situations: when a problem is developing faster than the Sentinel cycle can catch, and when the feature you need to see — a drainage line, a headland, a small patch — is smaller than a Sentinel pixel usefully resolves.
The honest guidance is that most growers are well served by the free source most of the time, and should reach for daily high-resolution imagery when something is actually happening rather than as a standing subscription habit.
Choosing The Right Index For The Question
Ten vegetation indices sounds like feature padding. It is not, because indices are not better and worse versions of each other — they are sensitive to different things, and the wrong one answers a question you did not ask.
When NDVI Is The Right Tool
NDVI measures the contrast between near-infrared and red reflectance, which tracks green biomass well. It is the default for a reason: through most of the growing season it is a reliable proxy for how much healthy canopy is there.
Its well-known failure is saturation. Once a canopy closes, NDVI stops distinguishing a good crop from an excellent one, and a mid-season field that looks uniformly strong may not be.
Where NDMI And MSAVI Earn Their Place
NDMI responds to moisture content rather than greenness, which makes it the index to look at when the question is water stress rather than vigour — often before the stress is visible in NDVI at all.
MSAVI is built for early season. With little canopy and a lot of visible soil, standard indices are contaminated by the soil's own reflectance; MSAVI corrects for it, which is why emergence assessment uses it rather than NDVI.
RECI And The Nitrogen Question
RECI uses the red-edge band and tracks chlorophyll content more directly, which makes it the more informative index for nitrogen status.
This is the index that connects monitoring to a decision with money attached, because chlorophyll variation across a field is the input a variable-rate nitrogen prescription is built from.
From Looking At Fields To Changing What You Do
A monitoring platform that only produces pictures generates work rather than saving it. The features that turn observation into action are the ones worth judging EOSDA on.
VRA maps convert in-field variation into a prescription a controller can execute, so a nitrogen or seed rate follows the field rather than an average of it. The John Deere integration matters here for an unglamorous reason: a prescription that cannot reach the machine is a PDF.
Growth stages tie observations to crop phenology, which is what makes an index reading interpretable — the same NDVI value means different things at emergence and at flowering. Risk maps flag areas warranting attention, weather analytics supply the context that explains most anomalies, and the field activity log records what was actually done, which is the only way next season's analysis means anything.
Yield estimation and automated reports serve the office rather than the field — useful for insurers, lenders and anyone managing land they do not personally walk. Team management exists because most of the real customers are consultants and organisations, not single growers.
The satellite tells you which field to walk. It does not tell you what you will find when you get there — and a platform that implied otherwise would be selling something it cannot deliver.
Working It Into A Season
The platform rewards a routine rather than occasional curiosity.
- Draw your field boundaries accurately once — every downstream figure inherits the errors in this step.
- Use MSAVI early for emergence and establishment, while bare soil still dominates the signal.
- Switch to NDVI for in-season vigour tracking, and treat sudden divergence between neighbouring zones as the signal worth investigating.
- Check NDMI when weather suggests water stress, rather than waiting for it to show up as lost vigour.
- Use RECI where nitrogen decisions are in play, and build variable-rate prescriptions from that rather than from raw greenness.
- Log every operation in the activity log as it happens, so next season's comparison has something honest to compare against.
- Walk the anomalies. Every time. The imagery is a prioritised list of places to stand, not a diagnosis.
The Limits Worth Knowing Before You Buy
Cloud is the fundamental constraint, and no amount of software removes it. EOSDA applies cloud and shadow removal, which is genuinely important — an uncorrected cloudy pass produces a dark patch that reads exactly like a crop problem — but correction fills gaps in the record rather than seeing through weather. In a persistently cloudy region, optical monitoring has bad weeks.
The second limit is diagnostic. Indices measure reflectance, and disease, pest damage, nutrient deficiency and compaction can all produce similar signatures. The platform reliably tells you where something is different; deciding what it is remains an agronomic judgement made on the ground.
Third, yield estimation is a model, and models carry uncertainty that a single headline number tends to hide. Treat estimates as ranges, particularly in an unusual season.
And finally the boundaries: EOSDA is one product in a wider EOS Data Analytics portfolio that includes LandViewer, EOS RayVision and EOSDA API Connect. If your need is raw imagery access or a different vertical entirely, the crop monitoring product may not be the right door.
Index Names, Decoded
Half the value of the platform is choosing the right layer. These are the four that do most of the work.
- NDVI
- Normalized Difference Vegetation Index. Tracks green biomass and is the general-purpose default. Saturates once the canopy closes, so it stops distinguishing good from excellent mid-season.
- NDMI
- Normalized Difference Moisture Index. Responds to moisture content, so it flags water stress — often before that stress is visible as lost vigour.
- MSAVI
- Modified Soil-Adjusted Vegetation Index. Corrects for bare-soil reflectance, which makes it the right choice early in the season when the canopy is sparse.
- RECI
- Red-Edge Chlorophyll Index. Tracks chlorophyll more directly than NDVI, which is why nitrogen decisions and variable-rate prescriptions are usually built from it.
- VRA
- Variable Rate Application. A prescription that varies inputs across a field instead of applying one rate everywhere — the point at which monitoring turns into a saving.
- Revisit interval
- How often a satellite passes over the same point. Sentinel-2 runs a fixed multi-day cycle; PlanetScope offers daily coverage, which matters when a problem moves faster than the cycle.
Key features of EOSDA Crop Monitoring
Remote crop health monitoring from Sentinel-2 and PlanetScope imagery
Ten vegetation indices including NDVI, NDMI, RECI and MSAVI
Cloud and shadow removal applied to imagery
Growth stage tracking tied to crop phenology
Risk maps highlighting areas that warrant attention
Variable rate application maps for prescriptions
John Deere integration for delivering prescriptions to machinery
Weather analytics alongside field observations
Yield estimation and automated reporting
Field activity log and team management for multi-user operations
Pros & cons
Pros
5- Index range is broad enough to answer different agronomic questions properly, not just show greenness
- Combines free Sentinel-2 with commercial PlanetScope, so cost and detail can be traded deliberately
- Cloud and shadow removal prevents the most common false alarm in optical monitoring
- VRA output and machinery integration close the loop between seeing variation and acting on it
- Activity logging and team features suit consultants managing many clients, not just single growers
Cons
5- Optical satellites cannot see through cloud, so persistently cloudy regions get gaps in the record
- Indices locate anomalies but cannot diagnose them — ground truthing stays essential
- Yield estimates are model outputs and carry uncertainty a single number tends to obscure
- Ten indices is only an advantage if you know which one answers your question
- Useless for greenhouse and covered production, where there is nothing for a satellite to observe
Best For
- Growers managing more land than they can scout on foot each week
- Agricultural consultants reporting consistently across a client portfolio
- Operations with variable-rate capable machinery that can act on prescriptions
- Insurers and lenders needing documented, dated field condition records
- Regional bodies monitoring crop conditions across many holdings
EOSDA Beside Other Agricultural Platforms
These all serve agriculture but sit at different points between raw observation and an executed decision.
| Tool | Primary data | Strength | Best suited to |
|---|---|---|---|
| EOSDA Crop Monitoring | Sentinel-2 and PlanetScope satellite imagery | Index depth plus VRA and machinery output | Growers and consultants managing many fields remotely |
| Taranis | High-resolution aerial imagery | Leaf-level detail that satellites cannot resolve | Operations needing to identify a pest or disease, not just locate it |
| Map My Crop | Satellite imagery and field analytics | Broad field intelligence across markets | Growers wanting an alternative satellite platform |
| Source.ag | Greenhouse sensor and operations data | Controlled-environment crop management | Glasshouse growers, where satellites are irrelevant |
Should You Put A Season Through It?
Earns Its Keep When
- You manage enough fields that walking all of them weekly is not realistic
- Your fields have real within-field variation that a uniform rate is wasting money on
- You have machinery capable of executing a variable-rate prescription
- You advise growers and need consistent reporting across many clients
- You need documented field records for insurance, lending or certification
Probably Skip It If
- You farm a small area you already walk regularly and know intimately
- Your region is cloudy enough that optical imagery has long gaps
- You grow under glass or cover, where satellite imagery sees nothing useful
- You have no way to act on within-field variation once you can see it
- You want a diagnosis rather than a prioritised list of places to investigate
Nearby Tools In Agriculture And Earth Observation
Different resolutions, different environments, different points in the decision chain.
- Taranis — leaf-level aerial imagery for identifying what a satellite anomaly actually is
- Map My Crop — an alternative satellite-based field analytics platform
- Source.ag — controlled-environment growing, where the satellite approach does not apply
- Insilico Medicine — another domain where AI claims are best judged against published, checkable results
Checked Against The Product Page
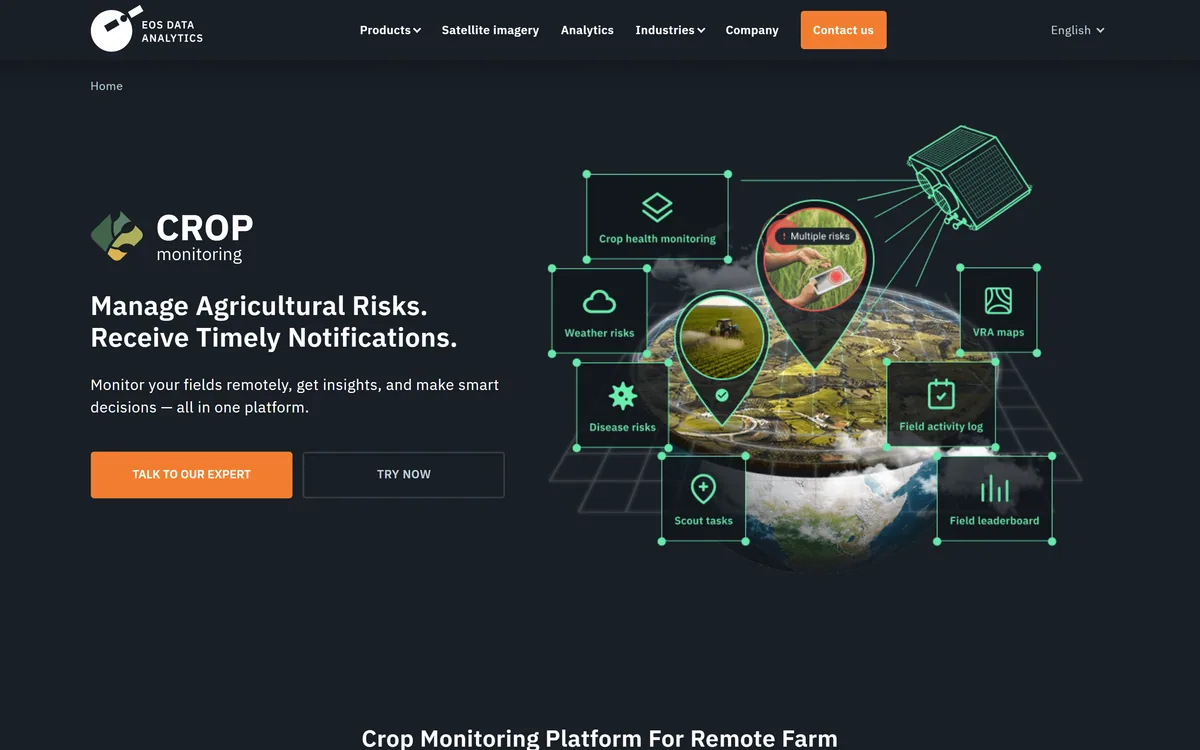
Last checked . Read from the EOSDA Crop Monitoring product page on eos.com during this check, with the screenshot above captured at the same time.
- Imagery sources given as Sentinel-2 and PlanetScope, with up to three-metre resolution and daily monitoring, stated on the product page
- Ten vegetation indices, with NDVI, NDMI, RECI and MSAVI named explicitly
- Cloud and shadow removal listed as a platform capability
- Named features — Growth Stages, Risk Map, VRA Maps, Field Activity Log, Yield Estimation, Weather Analytics, Automated Reports, Team Management — taken from the page
- John Deere integration listed on the product page
- Target users given as growers, agricultural consultants, insurance companies and regional monitoring organisations
- Company identified as EOS Data Analytics, Inc., with related products LandViewer, EOS RayVision and EOSDA API Connect
- Company, careers, FAQ, blog and policy pages confirmed present in the site footer
- No plan prices published here, in line with this site's pricing policy
The index guidance and the cautions about cloud cover, diagnostic limits and yield-model uncertainty are general remote-sensing points that apply to every optical monitoring platform, not criticisms specific to EOSDA.
Editor's Verdict
4.3/5EOSDA Crop Monitoring has an AInexfinder Editor Score of 4.3/5.
EOSDA Crop Monitoring pricing
AInexfinder does not list plan prices or billing details. For current pricing, plans, and trials, visit the official EOSDA Crop Monitoring website.
Visit official website for pricingVendor pricing, credits, and billing policies change over time. Always confirm on the official site before you buy.
Frequently asked questions
Which satellites does EOSDA Crop Monitoring use?
Sentinel-2, the European Space Agency's free programme, and PlanetScope, a commercial constellation offering up to three-metre resolution with daily revisit. Sentinel-2 covers season-long trend watching well; PlanetScope earns its cost when a problem is moving faster than the Sentinel cycle catches.
Which vegetation index should I actually use?
It depends on the question. MSAVI early in the season when bare soil dominates, NDVI for general in-season vigour, NDMI when you suspect water stress, and RECI for chlorophyll and nitrogen decisions. Using NDVI for everything is the most common way to misread a field.
What happens when it is cloudy?
Optical satellites cannot see through cloud. EOSDA applies cloud and shadow removal so a cloudy pass does not masquerade as a crop problem, but that fills a gap in the record rather than seeing through the weather. In persistently cloudy regions, expect periods with no usable imagery.
Can it tell me what is wrong with a field?
No, and no satellite platform can. It tells you reliably that an area is behaving differently from its neighbours. Disease, pests, nutrient deficiency and compaction can all look similar from orbit — identifying which one it is still means walking out there.
Will the variable-rate maps work with my equipment?
There is a John Deere integration, which matters because a prescription that cannot reach the controller is just a document. For other machinery, check the export formats your controller accepts before assuming the workflow closes.
How accurate is the yield estimation?
It is a model output, so it comes with uncertainty that a headline number hides. Treat it as a range rather than a figure, and expect it to be least reliable in exactly the unusual seasons when you most want it to be right.
Is this suitable for a small farm?
Less so. The value scales with how much land you cannot practically inspect and how much within-field variation you can act on. A small holding you walk regularly and know well gets far less out of it than an operation spread across many fields.
Reviews
Log in to write a review.
User Reviews
No reviews yet. Be the first to share your experience with EOSDA Crop Monitoring.
Reviewed by Daniel Reed
Assigned reviewer
Daniel ReedSenior AI Tools Reviewer
Daniel reviews AI tools the slow way — by actually using them on real projects. His reviews cover what works, what breaks, and who each tool is genuinely a good fit for.
Hands-on reviewsProduct testingAI software
Daniel and the AInexfinder editorial team research EOSDA Crop Monitoring using public product information, listing evidence, and (when available) hands-on checks. Scores reflect listing completeness and transparency — not paid placement.
- Last verified
- Methodology
- How we review AI tools
- Sources used
- eos.com/products/crop-monitoring
- AInexfinder listing fields (features, pros/cons, description)
- Public vendor pages when available
- Editorial policy
- Listings may include affiliate or sponsored placements, which are labeled when present. Editorial scores and cons are not sold. See our affiliate disclosure and review methodology.
Related tools
Iktos is an AI and robotics drug-discovery company combining generative molecular design (Makya), AI retrosynthesis (Spaya) and automated synthesis and testing robotics into a design-make-test-analyse loop aimed at shortening early drug discovery, offered to pharma and biotech research teams.
Insilico Medicine pairs the Pharma.ai software suite — PandaOmics, Chemistry42, inClinico and more — with its own clinical pipeline. Its lead candidate rentosertib, a TNIK inhibitor for idiopathic pulmonary fibrosis, has Phase IIa results published in Nature Medicine.
Persefoni is a carbon-accounting and sustainability-management platform for measuring, reporting and decarbonizing emissions across Scopes 1-3, with a financed-emissions module for financial services and a native AI copilot built on its own carbon-accounting model.
FreemiumEmerging & Specialized
Taranis provides AI crop intelligence from leaf-level aerial imagery, detecting stand counts, weeds, insect damage, nutrient deficiencies and disease pressure across whole fields. Its products include Taranis Yield Impact and Ag Assistant, with a mobile app and web dashboard.
CO2 AI is an enterprise sustainability platform that measures, reduces and reports corporate, product and supply-chain emissions in one system, with AI-driven emission-factor matching, product footprints at scale, abatement-cost curves and a supplier hub.
Compare:EOSDA Crop Monitoring vs Tamarind BioEOSDA Crop Monitoring vs IktosEOSDA Crop Monitoring vs Insilico MedicineEOSDA Crop Monitoring vs Persefoni
EOSDA Crop Monitoring alternatives Explore More
Embed this listing on your site
Featured on AInexfinder