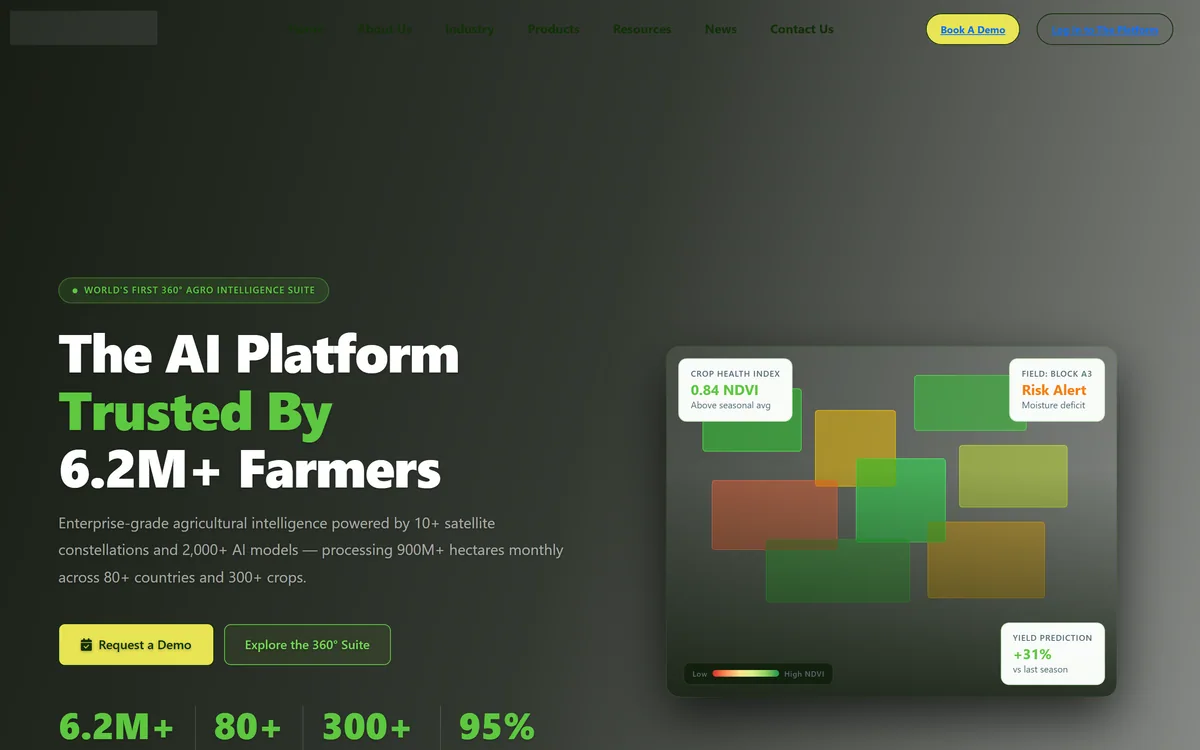
Map My Crop delivers agricultural intelligence from more than ten satellite constellations, covering automated field boundary detection, crop type identification, daily vegetation index monitoring, drone analysis, yield forecasting, irrigation modelling and risk scoring for lenders and insurers.
mapmycrop.com8 viewsAdded April 24, 20252K visitors
Map My Crop's homepage, captured 9 September 2026.
Map My Crop: Satellite Agronomy At Field Scale
Ten-plus satellite constellations, with NDVI and 20-plus vegetation indices updated daily.
Automated field boundary detection without surveys, plus crop type identification across 150-plus crops.
Three tiers — digitise the farm, optimise operations, then command-centre analytics for enterprises.
Built for eight buyer types, including banks, insurers, governments, cooperatives and plantation owners.
Hardcastle Agrotech Solutions, with ISO 27001, GDPR compliance, NVIDIA Inception and ISRO authorisation displayed.
What Can Satellites Actually See In A Field?
The platform is built on 24/7 satellite health surveillance with NDVI and more than twenty vegetation indices updated daily, alongside crop type identification using multispectral analysis.
Understanding what a satellite genuinely measures explains both why this works and where it stops.
A multispectral sensor reads reflected light in bands the eye cannot see, and healthy vegetation has a distinctive signature — it absorbs red light for photosynthesis and reflects near-infrared strongly. Stressed plants reflect differently, and they do so before any visible change appears.
That gap is the whole value. A moisture deficit, a nitrogen shortage or an early disease front alters the spectral signature days or weeks before a farmer walking the field would notice, and at that point intervention still works.
What a satellite cannot do is tell you why. An index showing depressed vigour in one corner of a field is a signal that something is wrong there, not a diagnosis — and distinguishing water stress from disease from a compacted headland still requires someone to go and look.
A satellite sees stress days before a farmer walking the field would. It cannot tell you whether the cause is water, disease or compaction.
Boundary Detection Without A Survey
The first tier's headline capability is precise field maps without surveys, with automated delineation in minutes and an accuracy figure quoted across 80-plus countries.
This sounds administrative and is genuinely foundational, because almost everything downstream depends on knowing where a field is.
Field boundaries in much of the world are not digitised. They exist in paper records, in local knowledge, or in nothing at all — and without them there is no unit to attach a crop type, a yield estimate, an insurance policy or a loan to.
Manual delineation is the conventional alternative and it is slow and expensive at scale. Automated detection from imagery turns a survey project into a processing job, which is what makes national-scale monitoring feasible at all.
The consequences reach well beyond agronomy. Insurance claim verification, subsidy administration and lending against land all rest on an accurate boundary, and that is why the same platform ends up selling to banks and governments rather than only to farmers.
Indices, Alerts And Acting On Them
Beyond monitoring, the platform offers disease identification in under five seconds, yield forecasts up to three months ahead, irrigation modelling with zone-specific water stress maps, and risk scoring for lenders.
Those four have very different evidential standing, and it is worth separating them.
Index monitoring and alerting is the solid ground. Detecting that a zone has diverged from the field average is a measurement, and acting on it is straightforward — go and look, then irrigate, treat or leave it.
Yield forecasting is harder and more valuable. It depends on modelling how the rest of the season will go, and the further ahead the forecast, the more it rests on weather that has not happened. A three-month-ahead forecast is a projection with a confidence interval, and the interval is the part that matters.
Risk scoring for lenders is the most consequential and the least visible. A score deciding whether a smallholder gets credit is a decision about someone's livelihood made partly by a model, and the right questions are what it uses, how it was validated, and what recourse a farmer has when it is wrong — the same governance questions any data platform selling into lending should expect, as with Intelligence Node in retail pricing.
Treat an index alert as a reason to visit, not a diagnosis.
Ask for the confidence interval on any yield forecast.
Check the revisit rate and cloud handling for your region.
Validate boundary detection against fields you know precisely.
For lending scores, ask what recourse a farmer has if one is wrong.
Coverage, Cloud And Revisit Rates
The platform states ten-plus satellite constellations and daily index updates across 900 million-plus hectares monthly in 80-plus countries.
Using many constellations rather than one is the correct architectural choice, and the reason is weather.
Optical satellites cannot see through cloud. A single constellation with a five-day revisit gives you an image every five days in theory and, during a wet growing season in a cloudy region, potentially nothing useful for a month — precisely when crop stress is developing fastest.
Combining constellations multiplies the chances of a clear view, because they pass at different times and orbits. It is the difference between a monitoring service and an occasional picture.
Radar-based sensing is the other answer to cloud, since radar penetrates it, and the site does not say whether any of its constellations are radar. That is the specific question to ask for any wet-season or tropical deployment, along with what the effective observation frequency is in your own region rather than the stated update cadence.
Reading A Page Dense With Numbers
The homepage carries an unusual density of quantified claims: yield increases, input cost reductions, forecast accuracy, water savings, default prediction improvement, customer retention and payback period, alongside two different figures for AI accuracy in different sections.
None carries a source, a study, a sample or a definition, and that is the thing to hold in mind while reading the rest.
A stated average yield increase, for instance, cannot be evaluated without knowing against what baseline, on which crops, in which regions and over how many seasons. Agriculture varies so enormously by geography and season that an average across 80 countries is close to uninterpretable.
One displayed testimonial refers to a yield improvement figure so large that it is very unlikely to describe yield in the agronomic sense, which is the kind of thing a careful editor would query before publishing.
None of that impugns the technology, which is real. It means the numbers are marketing rather than evidence, and the credible signals on the page are elsewhere: ISO 27001, a named ISRO authorisation, NVIDIA's programme, and the specificity of the product tiers. Exported field data still has to be analysed somewhere, which is Quadratic's job, and the source-linking discipline Daloopa applies to filings would suit these numbers well.
Monitoring A Farm From Orbit
Satellite agronomy fails when alerts arrive and nobody acts, which happens as soon as the alerts outnumber the people who can respond.
This sequence establishes trust in the data before scaling the coverage.
Validate boundary detection on fields whose acreage you know exactly.
Check the effective clear-image frequency in your region, not the stated cadence.
Ground-truth the first month of alerts by visiting the flagged zones.
Learn which index divergences matter on your crops and which do not.
Compare one yield forecast against your actual harvest before relying on it.
Decide who responds to an alert before switching alerts on.
Map My Crop: Data And Coverage
Company
Hardcastle Agrotech Solutions Inc., per the footer
Positioning
Described as the world's first 360-degree agro intelligence suite
Data sources
Ten-plus satellite constellations, plus drone imagery
Processing scale
900 million-plus hectares monthly, stated across 80-plus countries
Crops
300-plus supported, with 150-plus identifiable by crop type detection
Indices
NDVI plus more than twenty vegetation indices, updated daily
Tier one
Field boundary detection, crop type detection, crop monitoring and tree monitoring
Tier two
Drone monitoring, disease detection, yield prediction and forest monitoring
Tier three
Irrigation modelling, sustainability and ESG reporting, and risk intelligence
Buyers addressed
Banks and insurers, government, cooperatives, farmers, plantations, food processing, input companies and agro holdings
Certifications displayed
ISO 27001, GDPR compliance, NVIDIA Inception and ISRO authorisation
Presence
Six global offices, with white-label and API options
Is Satellite Monitoring Useful On Your Farm?
Watch from orbit when
Your holding is too large to inspect thoroughly every week.
Field boundaries are not yet digitised anywhere reliable.
You need evidence for an insurance claim or a subsidy return.
Irrigation is a major cost and zones vary across a field.
You are lending, insuring or aggregating across many farms.
Walk the field when
You farm a few fields you walk daily anyway.
Persistent cloud makes optical imagery unreliable in your region.
Nobody would act on an alert once it arrived.
You need a diagnosis rather than a signal that something is wrong.
Your crop or region falls outside what the platform covers.
Key features of Map My Crop
Automated field boundary delineation from imagery
Crop type detection across 150-plus crops
Daily NDVI and 20-plus vegetation indices
Individual tree health scoring for orchards
Drone imagery analysis at sub-metre precision
Yield forecasting up to three months ahead
Zone-specific irrigation modelling
Risk scoring and portfolio dashboards for lenders
Pros & cons
Pros
7
Multispectral monitoring genuinely detects stress before it is visible
Multiple constellations is the right answer to cloud cover
Automated boundary detection makes national-scale monitoring feasible
A tiered structure matches eight genuinely different buyer needs
ISO 27001, GDPR and a named ISRO authorisation are meaningful signals
Tree-level monitoring for orchards is a real specialism
White-label and API routes for organisations embedding the data
Cons
7
Outcome claims are numerous, prominent and entirely unsourced
Two different AI accuracy figures appear on the same page
One displayed testimonial cites a yield figure that strains credibility
Whether any sensing is radar-based, and so cloud-proof, is unstated
Satellite indices signal a problem without diagnosing it
Lending risk scores affect livelihoods and their validation is undisclosed
No pricing, so evaluation begins with a demo
Best For
Large holdings that cannot be inspected field by field
Governments monitoring national crop area and food security
Insurers verifying claims with satellite evidence
Plantation and orchard operators needing tree-level data
Cooperatives aggregating performance across member farms
Map My Crop Against Other Agritech Tools
Data platforms differ by what they observe and who they sell it to.
Thematic — traceability applied to unstructured input
Map My Crop: Read From The Field Pages
Last checked . Read from mapmycrop.com in a browser session on the date above, including the full footer. The screenshot was captured at the same time.
Positioned as the world's first 360-degree agro intelligence suite
Stated as powered by ten-plus satellite constellations and 2,000-plus AI models
Processing stated at 900 million-plus hectares monthly across 80-plus countries and 300-plus crops
Crop monitoring described as 24/7 with NDVI and 20-plus vegetation indices updated daily
Field boundary detection described as producing precise maps without surveys in minutes
Crop type detection stated across 150-plus crops using multispectral analysis
Three product tiers displayed, from farm digitisation to enterprise command centre
Yield forecasting stated up to three months ahead, and irrigation modelling with zone-specific stress maps
Risk intelligence described for lenders and insurers with portfolio dashboards
Eight buyer segments addressed, from banking and government to food processing
Two different AI accuracy figures displayed in different sections of the same page
Footer confirms Hardcastle Agrotech Solutions Inc., six global offices, and badges for ISO 27001, GDPR, NVIDIA Inception, ISRO authorisation and Google for Startups
What we could not confirm: any of the quantified outcome claims, none of which carries a source, sample, baseline or definition — including yield increase, input cost reduction, forecast accuracy, water saving, default prediction improvement and payback period; why two different AI accuracy figures appear on one page; whether any constellation is radar-based, which determines usability in cloudy regions; what the ISRO authorisation covers; how risk scores are validated or appealed; and pricing, which requires a demo. We did not monitor a field.
Editor's Verdict
4.0/5
The underlying technology here is real and well established — multispectral satellite imagery genuinely reveals crop stress before it is visible from a tractor, and daily vegetation indices across a large holding are information no amount of walking produces. The tiered structure from field digitisation through to lending risk scores is a sensible way to sell to eight very different buyers. What needs discounting is the claim density: yield increases, cost reductions, accuracy figures and forecast precision are stated repeatedly and sourced nowhere, and two different accuracy numbers appear on one page. AInexfinder Editor Score: 4.0/5.
Map My Crop pricing
AInexfinder does not list plan prices or billing details. For current pricing, plans, and trials, visit the official Map My Crop website.
Vendor pricing, credits, and billing policies change over time. Always confirm on the official site before you buy.
Frequently asked questions
What is Map My Crop?
A satellite agricultural intelligence platform covering field boundary detection, crop type identification, daily vegetation index monitoring, drone analysis, yield forecasting, irrigation modelling and risk scoring, from Hardcastle Agrotech Solutions.
What can a satellite actually see?
Reflected light in bands the eye cannot see. Healthy vegetation absorbs red and reflects near-infrared strongly; stressed plants reflect differently, and they do so days or weeks before any visible change appears.
Can it tell me what is wrong?
No. An index showing depressed vigour in one corner is a signal that something is wrong there, not a diagnosis. Distinguishing water stress from disease from a compacted headland still requires someone to go and look.
Why does using many satellites matter?
Cloud. Optical satellites cannot see through it, so a single constellation with a five-day revisit can give you nothing usable for a month during a wet season — exactly when stress develops fastest. Multiple constellations multiply the chances of a clear view.
What should I ask about cloud?
Whether any of the constellations are radar-based, since radar penetrates cloud, and what the effective clear-image frequency is in your own region rather than the stated daily update cadence.
Why does boundary detection matter so much?
Because everything attaches to a boundary — crop type, yield estimate, insurance policy, loan. In much of the world field boundaries are not digitised at all, and automated delineation turns a survey project into a processing job.
How reliable is a three-month yield forecast?
It depends on weather that has not happened. Treat it as a projection with a confidence interval and ask for the interval — the headline number without it tells you very little about how much to rely on.
Should I trust the outcome percentages?
Read them as marketing. Yield increase, cost reduction and accuracy figures appear repeatedly with no source, sample, baseline or definition, and two different accuracy numbers appear on the same page.
What are the credible signals then?
ISO 27001, GDPR compliance, a named ISRO authorisation and NVIDIA's programme membership, alongside the specificity of the product tiers. Those are checkable in ways an average yield increase across eighty countries is not.
What about risk scores for lending?
That is the most consequential feature and the least visible. A score deciding whether a smallholder gets credit is a decision about a livelihood, and the questions to press are what it uses, how it was validated, and what recourse exists when it is wrong.
Daniel reviews AI tools the slow way — by actually using them on real projects. His reviews cover what works, what breaks, and who each tool is genuinely a good fit for.
Daniel and the AInexfinder editorial team research Map My Crop using public product information, listing evidence, and (when available) hands-on checks. Scores reflect listing completeness and transparency — not paid placement.
Listings may include affiliate or sponsored placements, which are labeled when present. Editorial scores and cons are not sold. See our affiliate disclosure and review methodology.
Rodin (Hyper3D) is an AI 3D model generator that turns text prompts or a single image into detailed 3D assets, with 21 styles, generation controls, plugins for Blender, Unity and Unreal, an API and MCP, aimed at game, print, product and avatar creators.
Skybox AI by Blockade Labs generates 360-degree equirectangular panoramas and skyboxes with stated generation times as fast as 15 seconds, 32-bit HDRI export for scene lighting, a Unity plugin, MCP support and direct export to Blender and Unreal.
FPVTune analyses Betaflight blackbox logs with a neural network and returns PID and filter settings as one-click CLI commands. It also offers free crash analysis, motor health checks and a flight time calculator, and charges only when you accept the tuning result.
Instead is an AI agent platform for tax work spanning research across 1,500+ authoritative sources, document extraction from K-1s, W-2s and 1099s, multi-entity planning, and e-filing with the IRS, 48 states and cities across all five entity types. The platform is free, with agent work charged per credit.
Layla builds day-by-day itineraries from your dates, budget and travel style using live pricing and availability for flights, hotels, trains and activities. Human travel experts can take over at any stage to plan, book and manage the trip end to end. Layla AI GmbH is based in Berlin.
Decory is a free mobile AI interior design app that redesigns a room from a photo in about 30 seconds across 15+ styles. It also replaces and removes objects, previews flooring and wall colours, and searches furniture. Operated by The AI Journey Inc., with 500,000+ downloads claimed.