Quadratic is an AI spreadsheet that connects CSVs, Excel files, PDFs and live databases, then writes formulas, Python code and charts from plain-English questions. It positions readable code against unreadable nested formulas, and states 250,000+ users at companies and universities.
quadratichq.com8 viewsAdded December 19, 20258K visitors
Every organisation has a spreadsheet that runs something important and that nobody fully understands. It was built by someone who has left, it contains formulas nested five levels deep, and changing anything is a small act of faith.
That is not a discipline failure. Spreadsheet formulas are a programming language with no comments, no variable names, no functions and no way to test anything — and people build serious systems in them because the alternative required being a developer.
Quadratic's proposition is that the alternative no longer does: describe what you want, and the analysis arrives as code you can actually read.
Quadratic: A Spreadsheet That Writes Python
AI writes formulas, Python and charts from a plain-English question about your data.
Readable code instead of nested formulas — the site's own comparison makes the case better than any pitch.
Connects CSVs, Excel, PDFs and live databases, so the data does not need copying in.
Results stay a shareable spreadsheet, which is what makes the output usable by people who do not code.
250,000+ people claimed, at companies and universities. Operated by Quadratic Growth Inc.
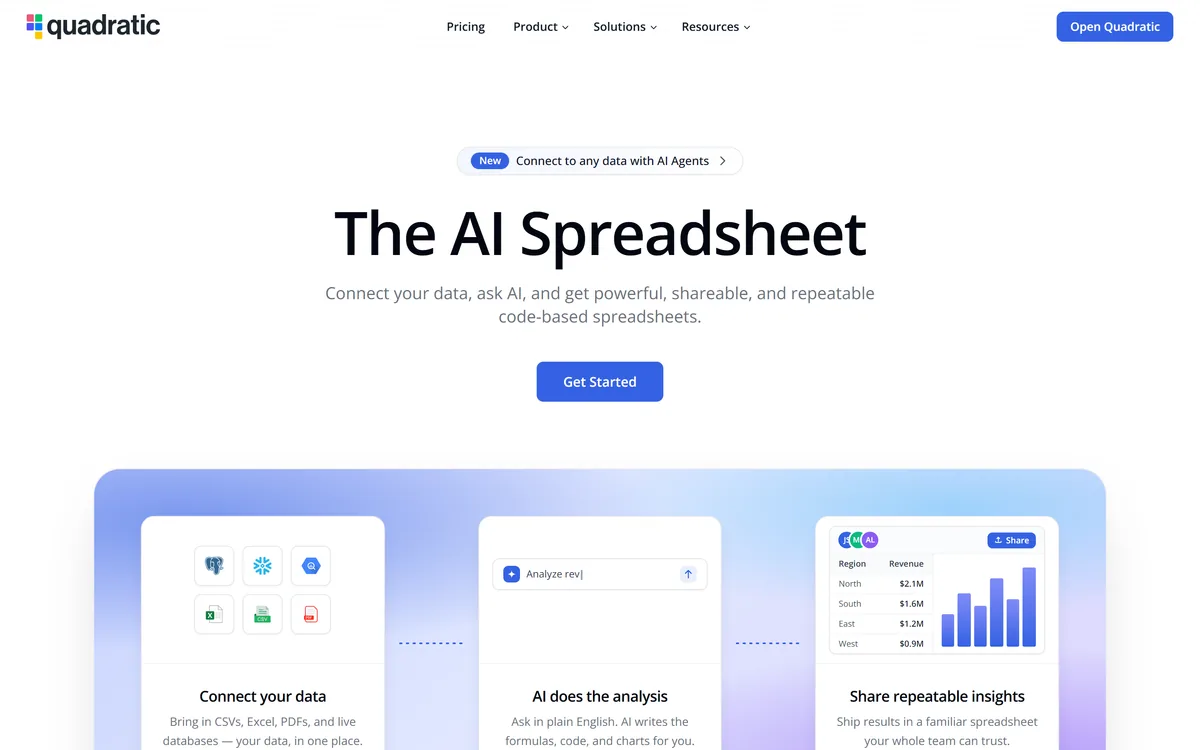
Quadratic's homepage, captured 9 September 2026, showing a formula compared against generated Python.
Why Replace A Formula With Code?
Quadratic's homepage shows the argument directly: a nested VLOOKUP wrapped in three IFERRORs across three sheets, described as hard to read, easy to break and impossible to debug, beside the equivalent Python with a comment explaining what it does.
That comparison is doing honest work, because the criticism of spreadsheet formulas is not aesthetic.
A complex formula has no names for its intermediate steps, no way to explain intent, and no mechanism for testing a part in isolation. When it produces a wrong number, finding out why means reading it inside out.
Code has all three. Variables carry names, comments carry intent, and each step can be checked independently — which is why software engineering built its practices around code rather than around formulas.
The consequence for auditability is the real gain. A generated formula you cannot read has to be trusted; generated code you can read has to be reviewed, and reviewing is a much better relationship with a system that produces numbers people act on.
A generated formula has to be trusted. Generated code has to be reviewed — and reviewing is a far better relationship with a number people will act on.
Connecting Live Databases To A Grid
Quadratic states it brings in CSVs, Excel files, PDFs and live databases, putting your data in one place, and describes AI agents connecting to any data.
The live database connection is the most consequential of those, and the reason is where spreadsheet errors actually come from.
Most serious spreadsheet mistakes are not calculation errors. They are stale data — an export taken last month, a copy that missed the last two hundred rows, a paste that silently truncated a column.
A live connection removes that class of error entirely, because the data is queried rather than transported. It also means the analysis can be re-run rather than rebuilt, which is what makes a spreadsheet a report instead of a snapshot.
The caution is access control. A spreadsheet with a live database connection is a query interface, and it inherits whatever permissions it was configured with — so who can open the file and what those credentials can reach becomes a security question rather than a convenience one.
Where Generated Analysis Goes Wrong
The risk with AI-written analysis is not that the code fails. It is that it runs perfectly and answers a slightly different question from the one you asked.
Ambiguity is the main source. Revenue by region sounds precise and is not: recognised or booked, which date field, in what currency, including or excluding refunds. The model picks an interpretation, and the answer looks equally confident either way.
Silent data problems are the second. Duplicate rows, inconsistent identifiers, nulls treated as zero — code handles whatever it is given, and a wrong answer from clean-looking code is harder to spot than an error message.
Statistical misuse is the third. A generated comparison may apply a test the data does not support, and the chart will be beautifully formatted regardless.
The mitigation is the thing readable code makes possible: check what it actually did on a subset you can verify by hand. That is the whole discipline, and it applies equally to any generated logic — the same reason review tools like cubic exist for code humans did not write.
Read the generated code, since being able to is the whole point.
State the ambiguous parts of a question explicitly — dates, currency, exclusions.
Verify against a subset you can check by hand before trusting a total.
Prefer a live connection over a pasted export, which is where staleness starts.
Treat the file as a query interface and control who can open it.
Shareable Results Are The Point
Quadratic emphasises shipping results in a familiar spreadsheet your whole team can trust, with shareable, repeatable outputs.
That framing matters because it is the answer to an obvious objection: if you want code, use a notebook.
The reason people do not is distribution. A notebook is a developer artefact — colleagues cannot open it, edit a number, or use it without help, so analysis done there stays with the analyst.
A spreadsheet is universally readable. Anyone can open it, change an input, and see what happens, which is why finance and operations run on them despite every technical objection.
Quadratic's position is to keep the distribution properties of a spreadsheet while replacing its worst property — opaque formulas — with something auditable. That is a genuinely good trade and it explains why the grid remains the interface.
The Jobs A Grid Should Not Take On
It is worth being clear about where this fits, because a spreadsheet with code in it is not a data platform.
It is not a warehouse. Analysis at genuine scale belongs where the data lives, and pulling millions of rows into a grid to reason about them is the wrong architecture whatever the interface.
It is not a pipeline. Scheduled transformation, dependency management and data quality testing are a different discipline, and a spreadsheet running on demand does not replace them.
It is not a BI tool. Governed metrics, consistent definitions and dashboards everyone trusts require a semantic layer, and spreadsheets are famously where consistent definitions go to diverge.
Where it fits is the enormous middle: exploratory analysis, ad hoc questions, reports that need to be shared and changed, and the work that currently happens in a spreadsheet badly. That is most analysis in most organisations.
It also does not remember what you did. Reconstructing why an analysis was built a particular way three weeks later is a recall problem rather than a data one, which is the gap continuous-capture tools such as Pieces address from an entirely different direction.
And generated code that runs in production deserves the same scrutiny as any other. Once a spreadsheet becomes a recurring report, the logic inside it is software — which is where testing tools like Promptfoo and ordinary code review practices become relevant rather than excessive.
Analysing Data In Quadratic Without Errors
Generated analysis fails quietly, which means the discipline has to be applied before you trust a number rather than after somebody questions it.
This sequence uses the readability that makes the tool worth choosing.
Connect the source directly rather than pasting an export.
Write the question with the ambiguities resolved — dates, currency, exclusions.
Read the generated code before looking at the answer.
Verify the result against a small subset you can compute by hand.
Add a comment explaining why the analysis was done, not just what it does.
Check who can open the file, since a live connection is a query interface.
Key features of Quadratic
AI-generated formulas, Python and charts from plain English
Live database connections
CSV, Excel and PDF import
Readable code in spreadsheet cells
Shareable, repeatable spreadsheet output
AI agents for connecting data sources
Templates and recipes
A published changelog and status page
Pros & cons
Pros
7
Generated code is reviewable in a way a generated formula never is
Named variables and comments carry intent that formulas cannot express
Live connections remove the stale-export errors that cause most spreadsheet mistakes
Keeps the distribution advantage of a spreadsheet over a notebook
Analysis becomes repeatable rather than a snapshot
A named operating company with Trust, Security and Compliance pages
Published templates, recipes and a changelog
Cons
7
Generated analysis answers the question it inferred, which may not be yours
Silent data problems produce confident wrong answers from clean-looking code
A statistical test the data does not support still produces a beautiful chart
A live connection makes the file a query interface with inherited permissions
Not a warehouse, a pipeline or a BI tool, and not a substitute for any of them
Where Python executes and whether data leaves the browser is unstated
Which databases are supported and how credentials are stored is not described
Best For
Analysts who inherit spreadsheets nobody can read
Teams whose reports depend on manually refreshed exports
People who can read code but work with colleagues who cannot
Operations and finance functions running on spreadsheets
Anyone doing exploratory analysis that has to be shared
Quadratic Against Other Data Tools
Data tools differ by who can use the output and where the analysis lives.
What we could not confirm: pricing and how AI usage is metered; which models generate the code; where the Python actually executes and whether your data leaves the browser; which databases are supported and how credentials are stored, which is the security question that matters most; row and file size limits; and whether generated code can be edited by hand after generation. We did not connect any data.
More Data And Productivity Tools
Adjacent products for analysis, monitoring and the systems that feed a spreadsheet.
Cometly — one specific analytical question answered properly
Puzzle — the ledger many spreadsheets are trying to reconcile
Pieces — recalling the analysis you did three weeks ago
Promptfoo — testing generated logic rather than trusting it
Editor's Verdict
4.2/5
The argument Quadratic makes is one anyone who has inherited a spreadsheet will recognise immediately: a five-level nested VLOOKUP is unreadable, unverifiable and impossible to debug, while the equivalent Python is none of those things. Generating readable code instead of an opaque formula is a genuine improvement in auditability, not just convenience. Connecting live databases into the same grid removes the copy-paste step where most spreadsheet errors originate. The permanent caution is that generated analysis is confident and plausible even when the question was subtly wrong. AInexfinder Editor Score: 4.2/5.
Quadratic pricing
AInexfinder does not list plan prices or billing details. For current pricing, plans, and trials, visit the official Quadratic website.
Vendor pricing, credits, and billing policies change over time. Always confirm on the official site before you buy.
Frequently asked questions
What is Quadratic?
Quadratic is an AI spreadsheet that connects CSVs, Excel files, PDFs and live databases, then writes formulas, Python code and charts from plain-English questions. Results stay in a familiar shareable spreadsheet, and it states 250,000+ users.
Why is generated code better than a generated formula?
Because you can review it. A complex formula has no names for intermediate steps, no way to express intent and no mechanism for testing a part in isolation. Code has variables, comments and independently checkable steps.
What does that change in practice?
Auditability. A generated formula you cannot read has to be trusted; generated code you can read has to be reviewed — which is a much better relationship with a system producing numbers people will act on.
Why do live database connections matter?
Because most serious spreadsheet mistakes are not calculation errors, they are stale data: an export from last month, a copy that missed rows, a paste that truncated a column. Querying rather than transporting removes that class of error entirely.
What is the risk with a live connection?
The file becomes a query interface with whatever permissions it was configured with. Who can open it, and what those credentials can reach, becomes a security question rather than a convenience one.
How does generated analysis go wrong?
Not by failing. By running perfectly and answering a slightly different question. Revenue by region sounds precise and is not — recognised or booked, which date field, which currency, including refunds or not. The model picks, and the answer looks confident either way.
How do I protect against that?
State the ambiguities explicitly in the question, read the generated code, and verify against a subset you can compute by hand. Being able to do that second step is the entire reason to prefer code over a formula.
Why not just use a notebook?
Distribution. A notebook is a developer artefact — colleagues cannot open it, change a number or use it without help, so analysis done there stays with the analyst. A spreadsheet is universally readable, which is why organisations run on them.
Is this a replacement for a data warehouse?
No. Analysis at genuine scale belongs where the data lives, and pulling millions of rows into a grid is the wrong architecture whatever the interface. It is also not a pipeline or a BI tool with governed metrics.
So where does it fit?
The enormous middle: exploratory analysis, ad hoc questions, reports that need sharing and changing, and the work currently done in spreadsheets badly. That is most analysis in most organisations, which is a large space to occupy.
Daniel reviews AI tools the slow way — by actually using them on real projects. His reviews cover what works, what breaks, and who each tool is genuinely a good fit for.
Daniel and the AInexfinder editorial team research Quadratic using public product information, listing evidence, and (when available) hands-on checks. Scores reflect listing completeness and transparency — not paid placement.
Listings may include affiliate or sponsored placements, which are labeled when present. Editorial scores and cons are not sold. See our affiliate disclosure and review methodology.
Napkin AI is a visual communication platform in two parts: Napkin Visuals converts text into diagrams and graphics, and Napkin Slides generates full presentation decks. Output exports to PPT, PNG, PDF and SVG, with 60+ content languages and collaborative editing.
RowSpeak is an AI data-analysis tool for spreadsheet-heavy teams: it analyses Excel, CSV, PDF and image tables in plain English, cleans data, generates charts, reports and dashboards, and converts PDFs and images into editable spreadsheets.
Document360 is knowledge base and documentation software built around Eddy AI, combining conversational search that cites its sources, an AI chatbot over scattered documents and tickets, a writing agent inside the editor, and an MCP server that exposes the knowledge base to ChatGPT, Claude and Copilot.
Notion AI is the assistant built into Notion — writing and editing in docs, agents that run recurring work like triage and reporting, AI Meeting Notes, and Enterprise Search across connected tools such as Slack, GitHub, Gmail, and Google Drive.